
As of 5:46 PM ET, Saturday, Oct 17, 2026. Season totals from Colorado State University's real-time tables (updated 5 PM ET) and the National Hurricane Center's season tables (5 PM ET). Champi from NWS Guam Advisory 14 and JTWC Warning 14. This page is updated in place.
The 2026 Pacific hurricane season east of the Date Line has already put more energy into its storms than any season in a record that goes back to 1949, and it still has about six weeks to run. The surprise is how it got there. It did not do it with a crowd of storms. It did it with storms that lasted longer and blew harder.
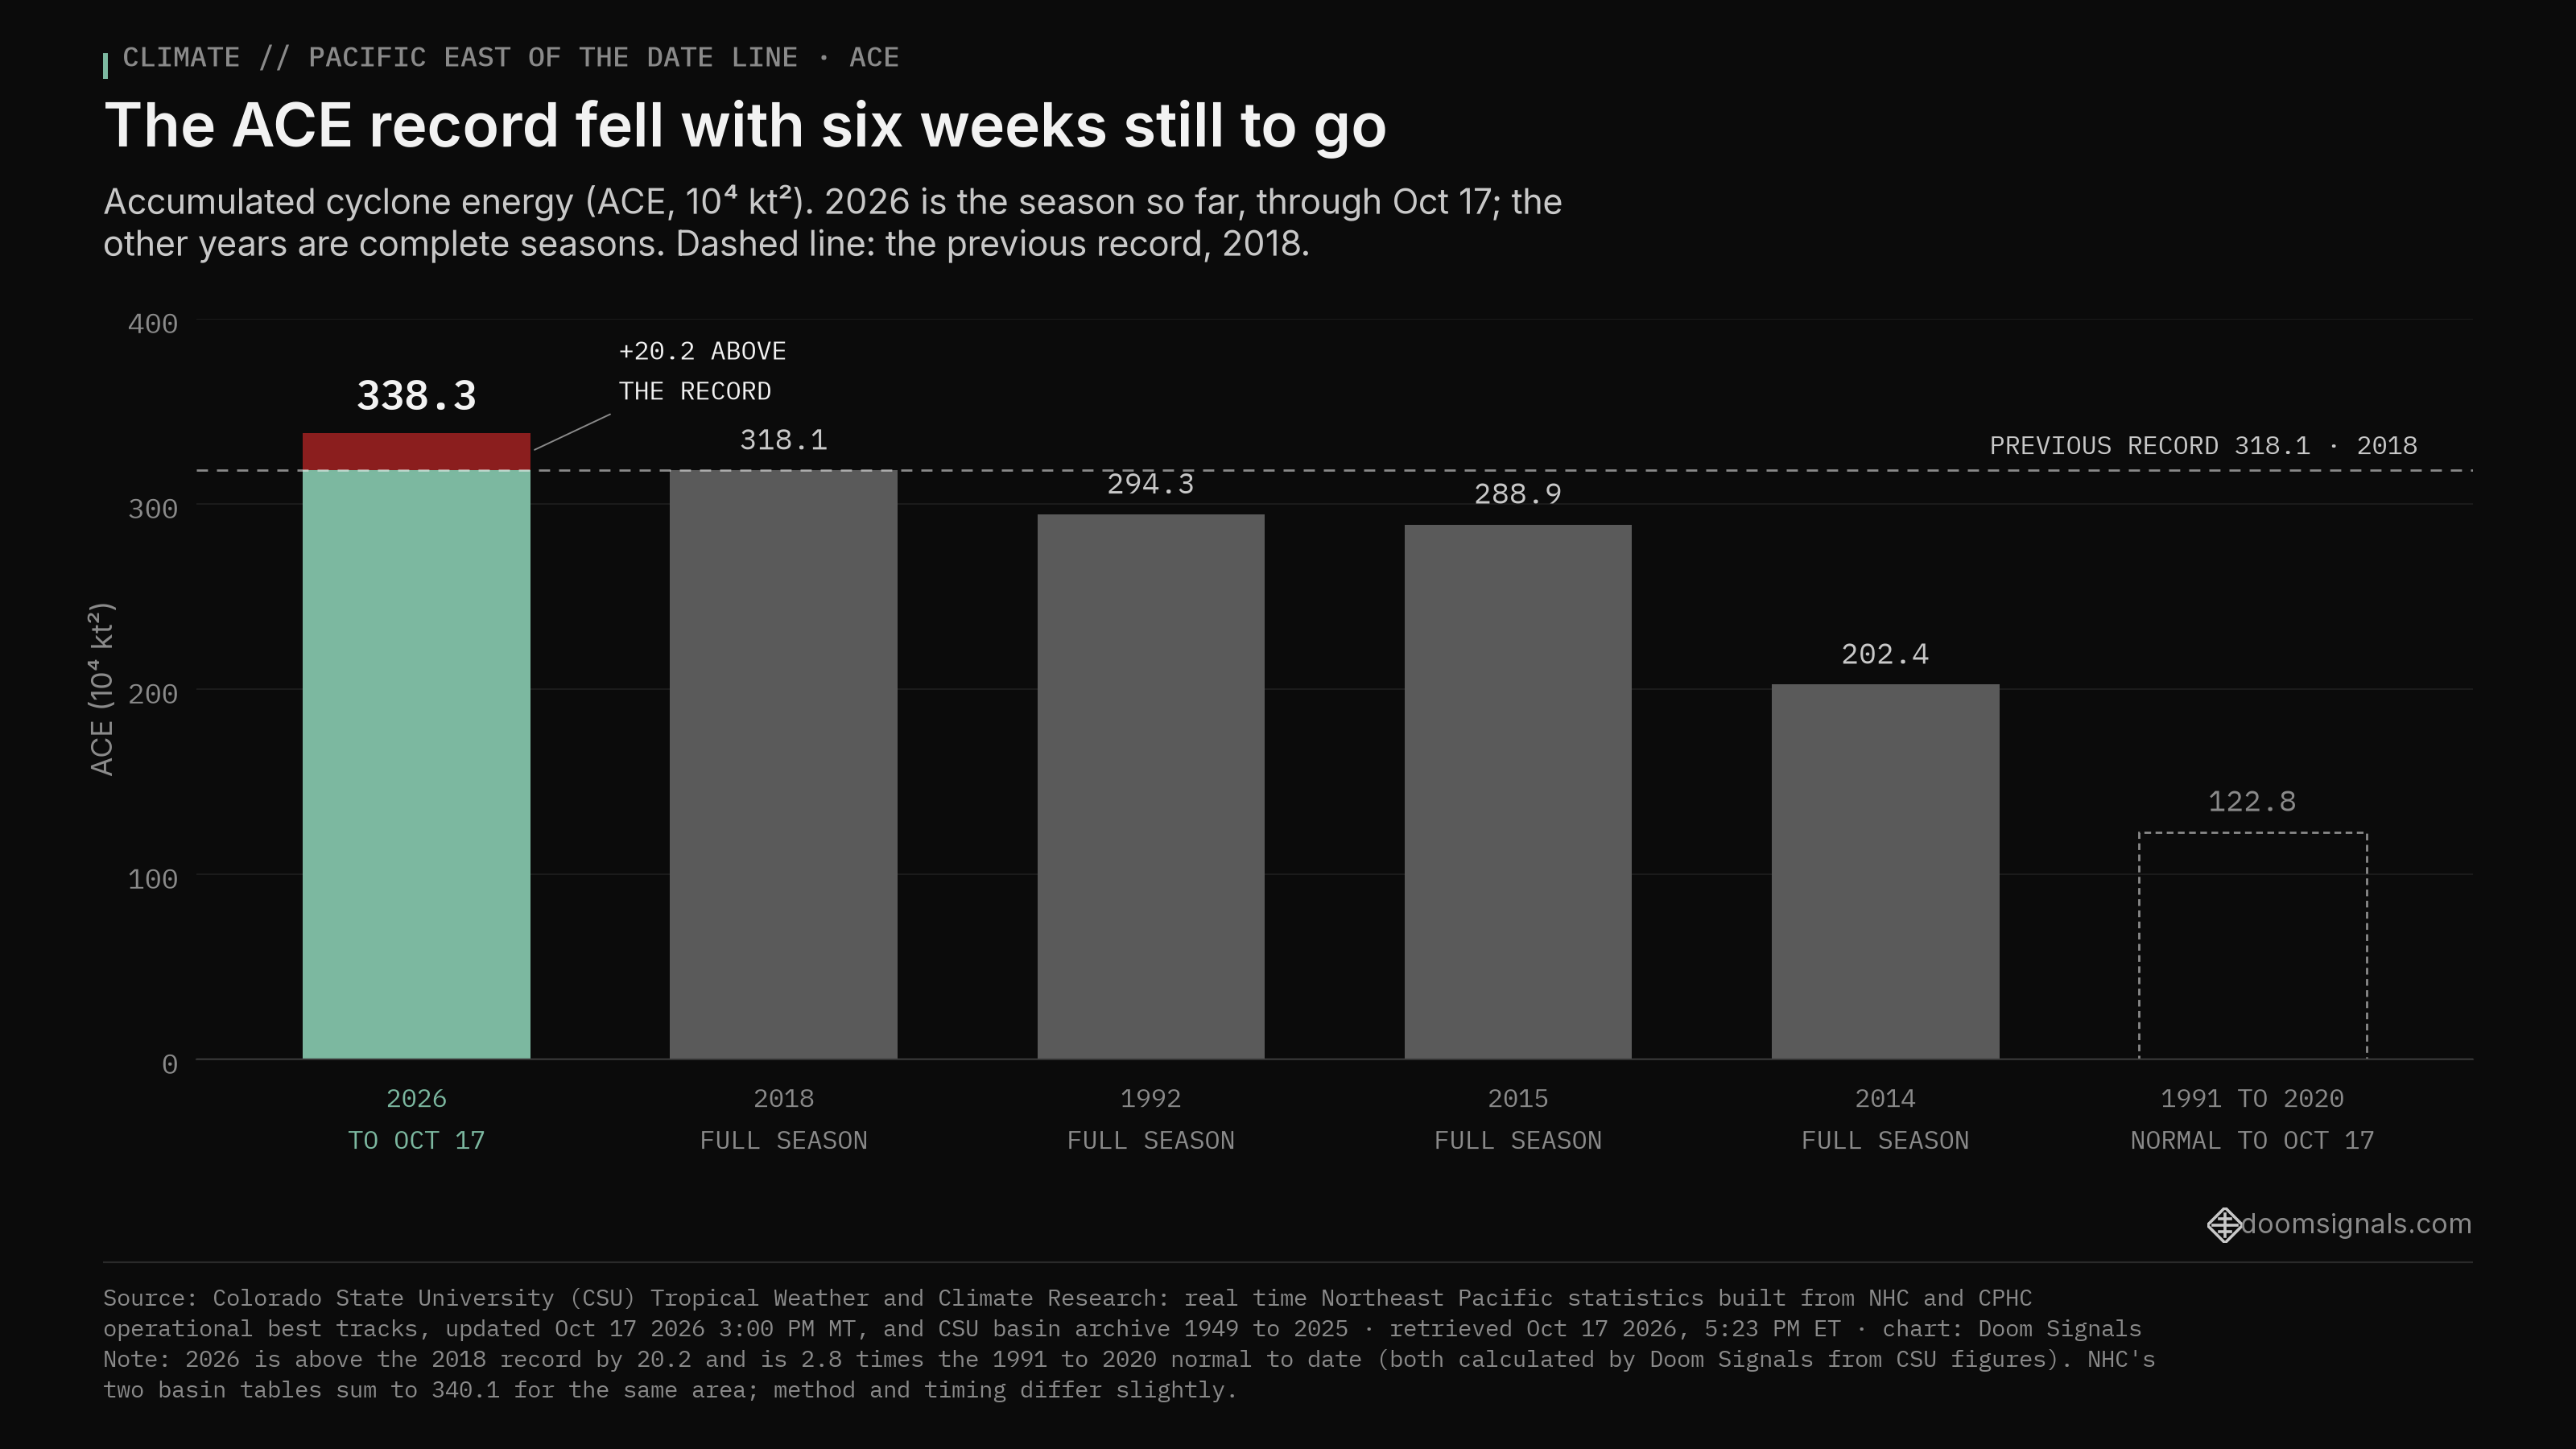
Forecasters measure that with accumulated cyclone energy, or ACE, a running total that grows with both a storm's strength and how long it holds that strength. By Colorado State University's count, the Pacific east of the Date Line stands at 338.3 for 2026. The old full season record was 318.1, set in 2018, so this season is already 20.2 above it, by our calculation from CSU's figures.
How active has the 2026 Pacific season been?
Very active east of the Date Line, where storm energy is at a record, and busy but well short of a record in the West Pacific.
East of the Date Line, which takes in both the eastern and central Pacific, CSU counts 22 named storms, 12 hurricanes and 10 major hurricanes so far. A normal season would have about 15, 8 and 4 by this date. The season's ACE is 2.8 times the normal of 122.8 for this date, by our calculation from CSU's figures, and the storms have spent 72.5 days at hurricane strength, against a normal of 26.4.
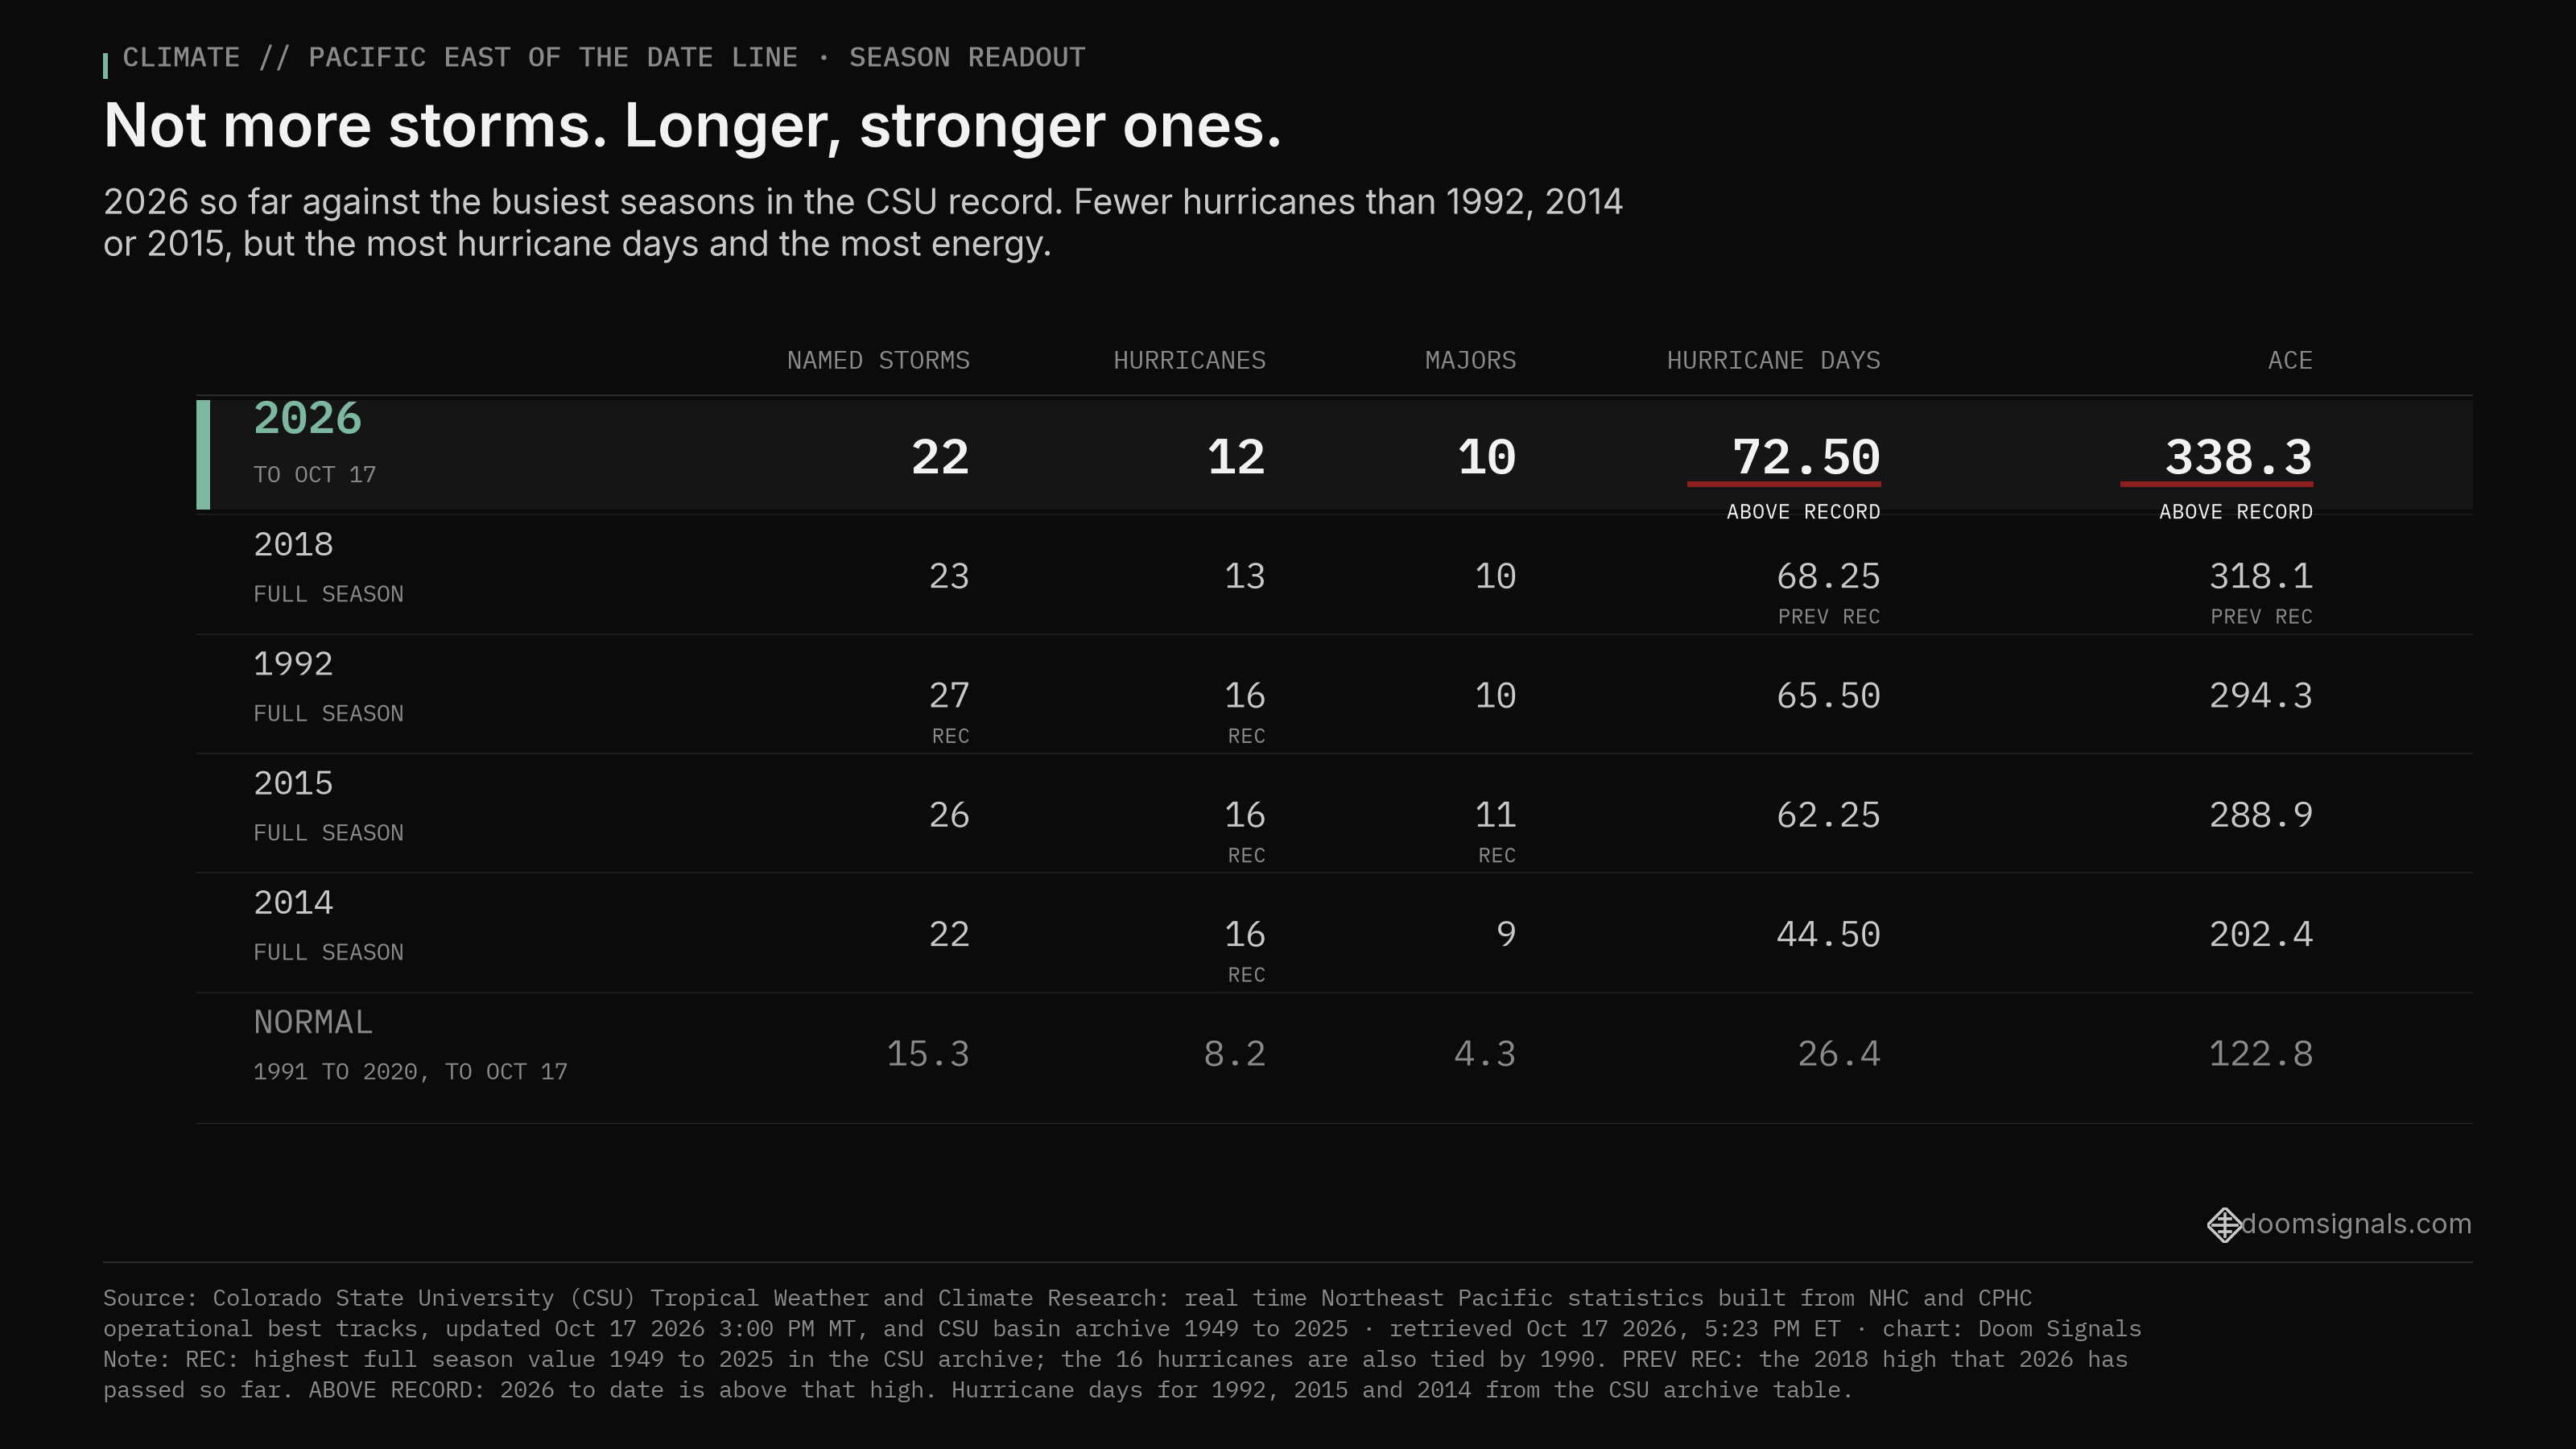
The same CSU counts as text, in the order named storms, hurricanes, major hurricanes, hurricane days and ACE:
- 2026 so far, through Oct 17: 22 named storms, 12 hurricanes, 10 major hurricanes, 72.50 hurricane days, ACE 338.3.
- 2018, full season: 23 named storms, 13 hurricanes, 10 major hurricanes, 68.25 hurricane days, ACE 318.1.
- 1992, full season: 27 named storms, 16 hurricanes, 10 major hurricanes, 65.50 hurricane days, ACE 294.3.
- 2015, full season: 26 named storms, 16 hurricanes, 11 major hurricanes, 62.25 hurricane days, ACE 288.9.
- 2014, full season: 22 named storms, 16 hurricanes, 9 major hurricanes, 44.50 hurricane days, ACE 202.4.
- Normal through Oct 17 (1991 to 2020): 15.3 named storms, 8.2 hurricanes, 4.3 major hurricanes, 26.4 hurricane days, ACE 122.8.
Source: Colorado State University Tropical Weather and Climate Research, Northeast Pacific real-time statistics (NHC and CPHC operational best tracks, updated 5 PM ET Oct 17, 2026) and Northeast Pacific historical statistics, 1949 to 2025.
The full season highs in CSU's archive, 1949 to 2025, are 27 named storms (1992), 16 hurricanes (1990, 1992, 2014 and 2015), 11 major hurricanes (2015), 68.25 hurricane days (2018) and ACE of 318.1 (2018). Record comparisons are our calculations from CSU's tables.
Read the rows side by side and the shape of the season shows. Five full seasons since 1949 had more named storms than 2026 has now, and nine had more hurricanes. None had more storm energy or more hurricane days.
How many eastern Pacific hurricanes so far? (NHC)
NHC counts 9 hurricanes and 7 major hurricanes in its eastern Pacific basin, and 5 hurricanes and 3 majors in its central Pacific basin.
The National Hurricane Center splits the ocean east of the Date Line at 140 degrees west. East of that line, its season table shows 19 named storms, 9 hurricanes and 7 major hurricanes, with ACE of 232.0. Between 140 west and the Date Line, the area the Central Pacific Hurricane Center watches, it shows 6 named storms, 5 hurricanes and 3 majors, with ACE of 108.1.
Those two sets of counts cannot simply be added. Several storms, among them Karina, Lowell and Nolo, crossed 140 west and appear in both tables. CSU's single count for the whole area is 22.
In May, NOAA's outlook for the eastern Pacific called for 15 to 22 named storms, 9 to 14 hurricanes and 5 to 9 major hurricanes. The season has landed inside all three ranges so far. For the central Pacific, NOAA expected 5 to 13 tropical cyclones, and its table now lists 7. NOAA tied its outlook to El Niño, then expected to be moderate or stronger.
There was a run of strength late in the season. By our count of CSU's storm table, every hurricane since Marie in early September has reached major strength: Nolo, Odalys, Polo, Rachel, Simon and Trudy. Three storms, Genevieve, Lowell and Polo, peaked at Category 5 strength in CSU's table, and Polo carried the most energy of any storm east of the Date Line this year, an ACE of 50.2.
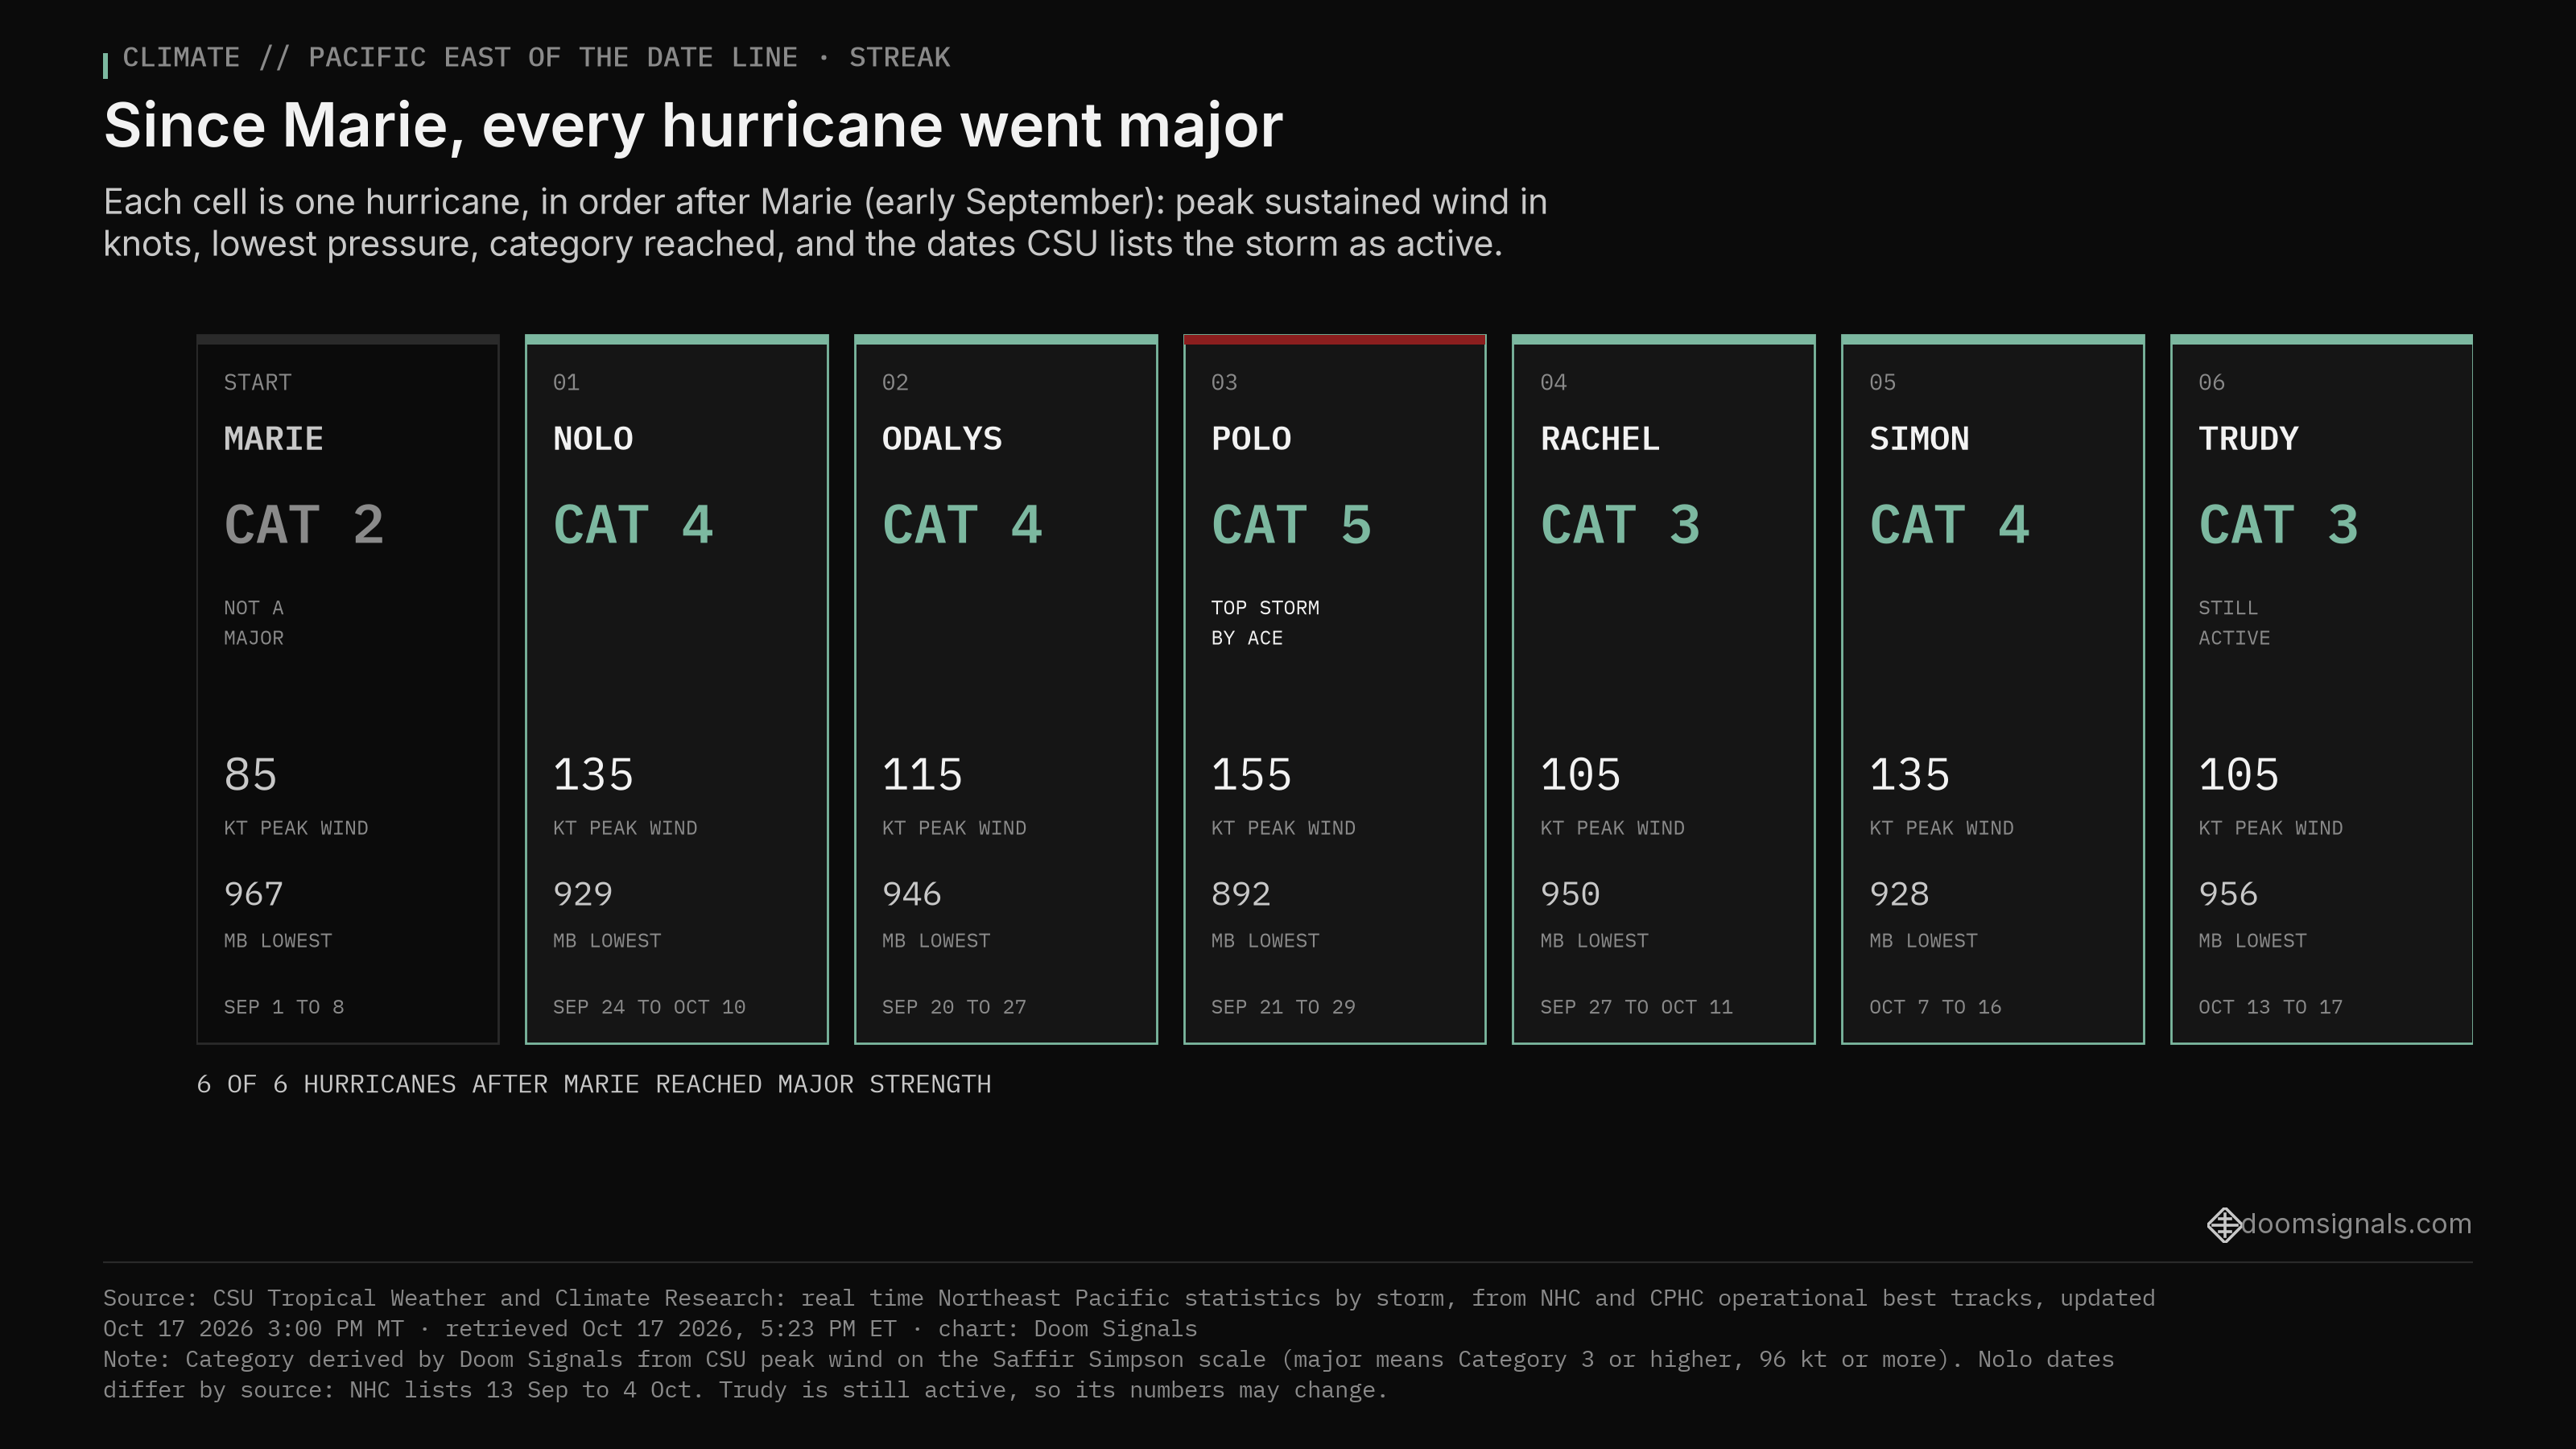
Sources differ on when Nolo began. NHC's season table lists it from Sep 13 to Oct 4, while CSU lists it from Sep 24, as a central Pacific storm. The streak above uses CSU's dates.
How many western Pacific typhoons so far? (JMA/JTWC)
The Japan Meteorological Agency has named 30 storms in the western Pacific this year through Oct 16, above its yearly average of about 25, and Champi is number 30.
JMA is the agency that names western Pacific storms, and its provisional table puts the 2026 total at 30 through Oct 16. Its average for a full year, 1991 to 2020, works out to 25.1, and its record is 39, in 1967. JMA's list shows 10 storms formed in August, which ties 1960 and 1966 for the most in any August since its table begins in 1951. Its list also shows a storm forming in every month from January through October, which only 1965 and 2015 had done before. JMA's 30 includes Nolo, which crossed the Date Line from the east, and some weaker systems the U.S. military's Joint Typhoon Warning Center did not count.
CSU's tables, built from JTWC tracks, give a second view: 25 named storms, 13 typhoons and 9 typhoons of Category 3 strength or more, with ACE of 299.6.
- 2026 to Oct 16, JMA count: 30 named storms.
- JMA yearly average, 1991 to 2020: 25.1 named storms. JMA record: 39, in 1967.
- 2026 so far, CSU from JTWC tracks: 25 named storms, 13 typhoons, 9 of Category 3 strength or more, ACE 299.6, 59.25 typhoon days.
- Normal through Oct 17, CSU (1991 to 2020): 20.7 named storms, 12.7 typhoons, 7.2 of Category 3 or more, ACE 226.1, 49.1 typhoon days.
Source: Japan Meteorological Agency, typhoon generation statistics (provisional, Japan time basis), and CSU Northwest Pacific real-time statistics, updated 5 PM ET Oct 17, 2026. The JMA average is calculated by Doom Signals from JMA's table, which gives counts of named storms only.
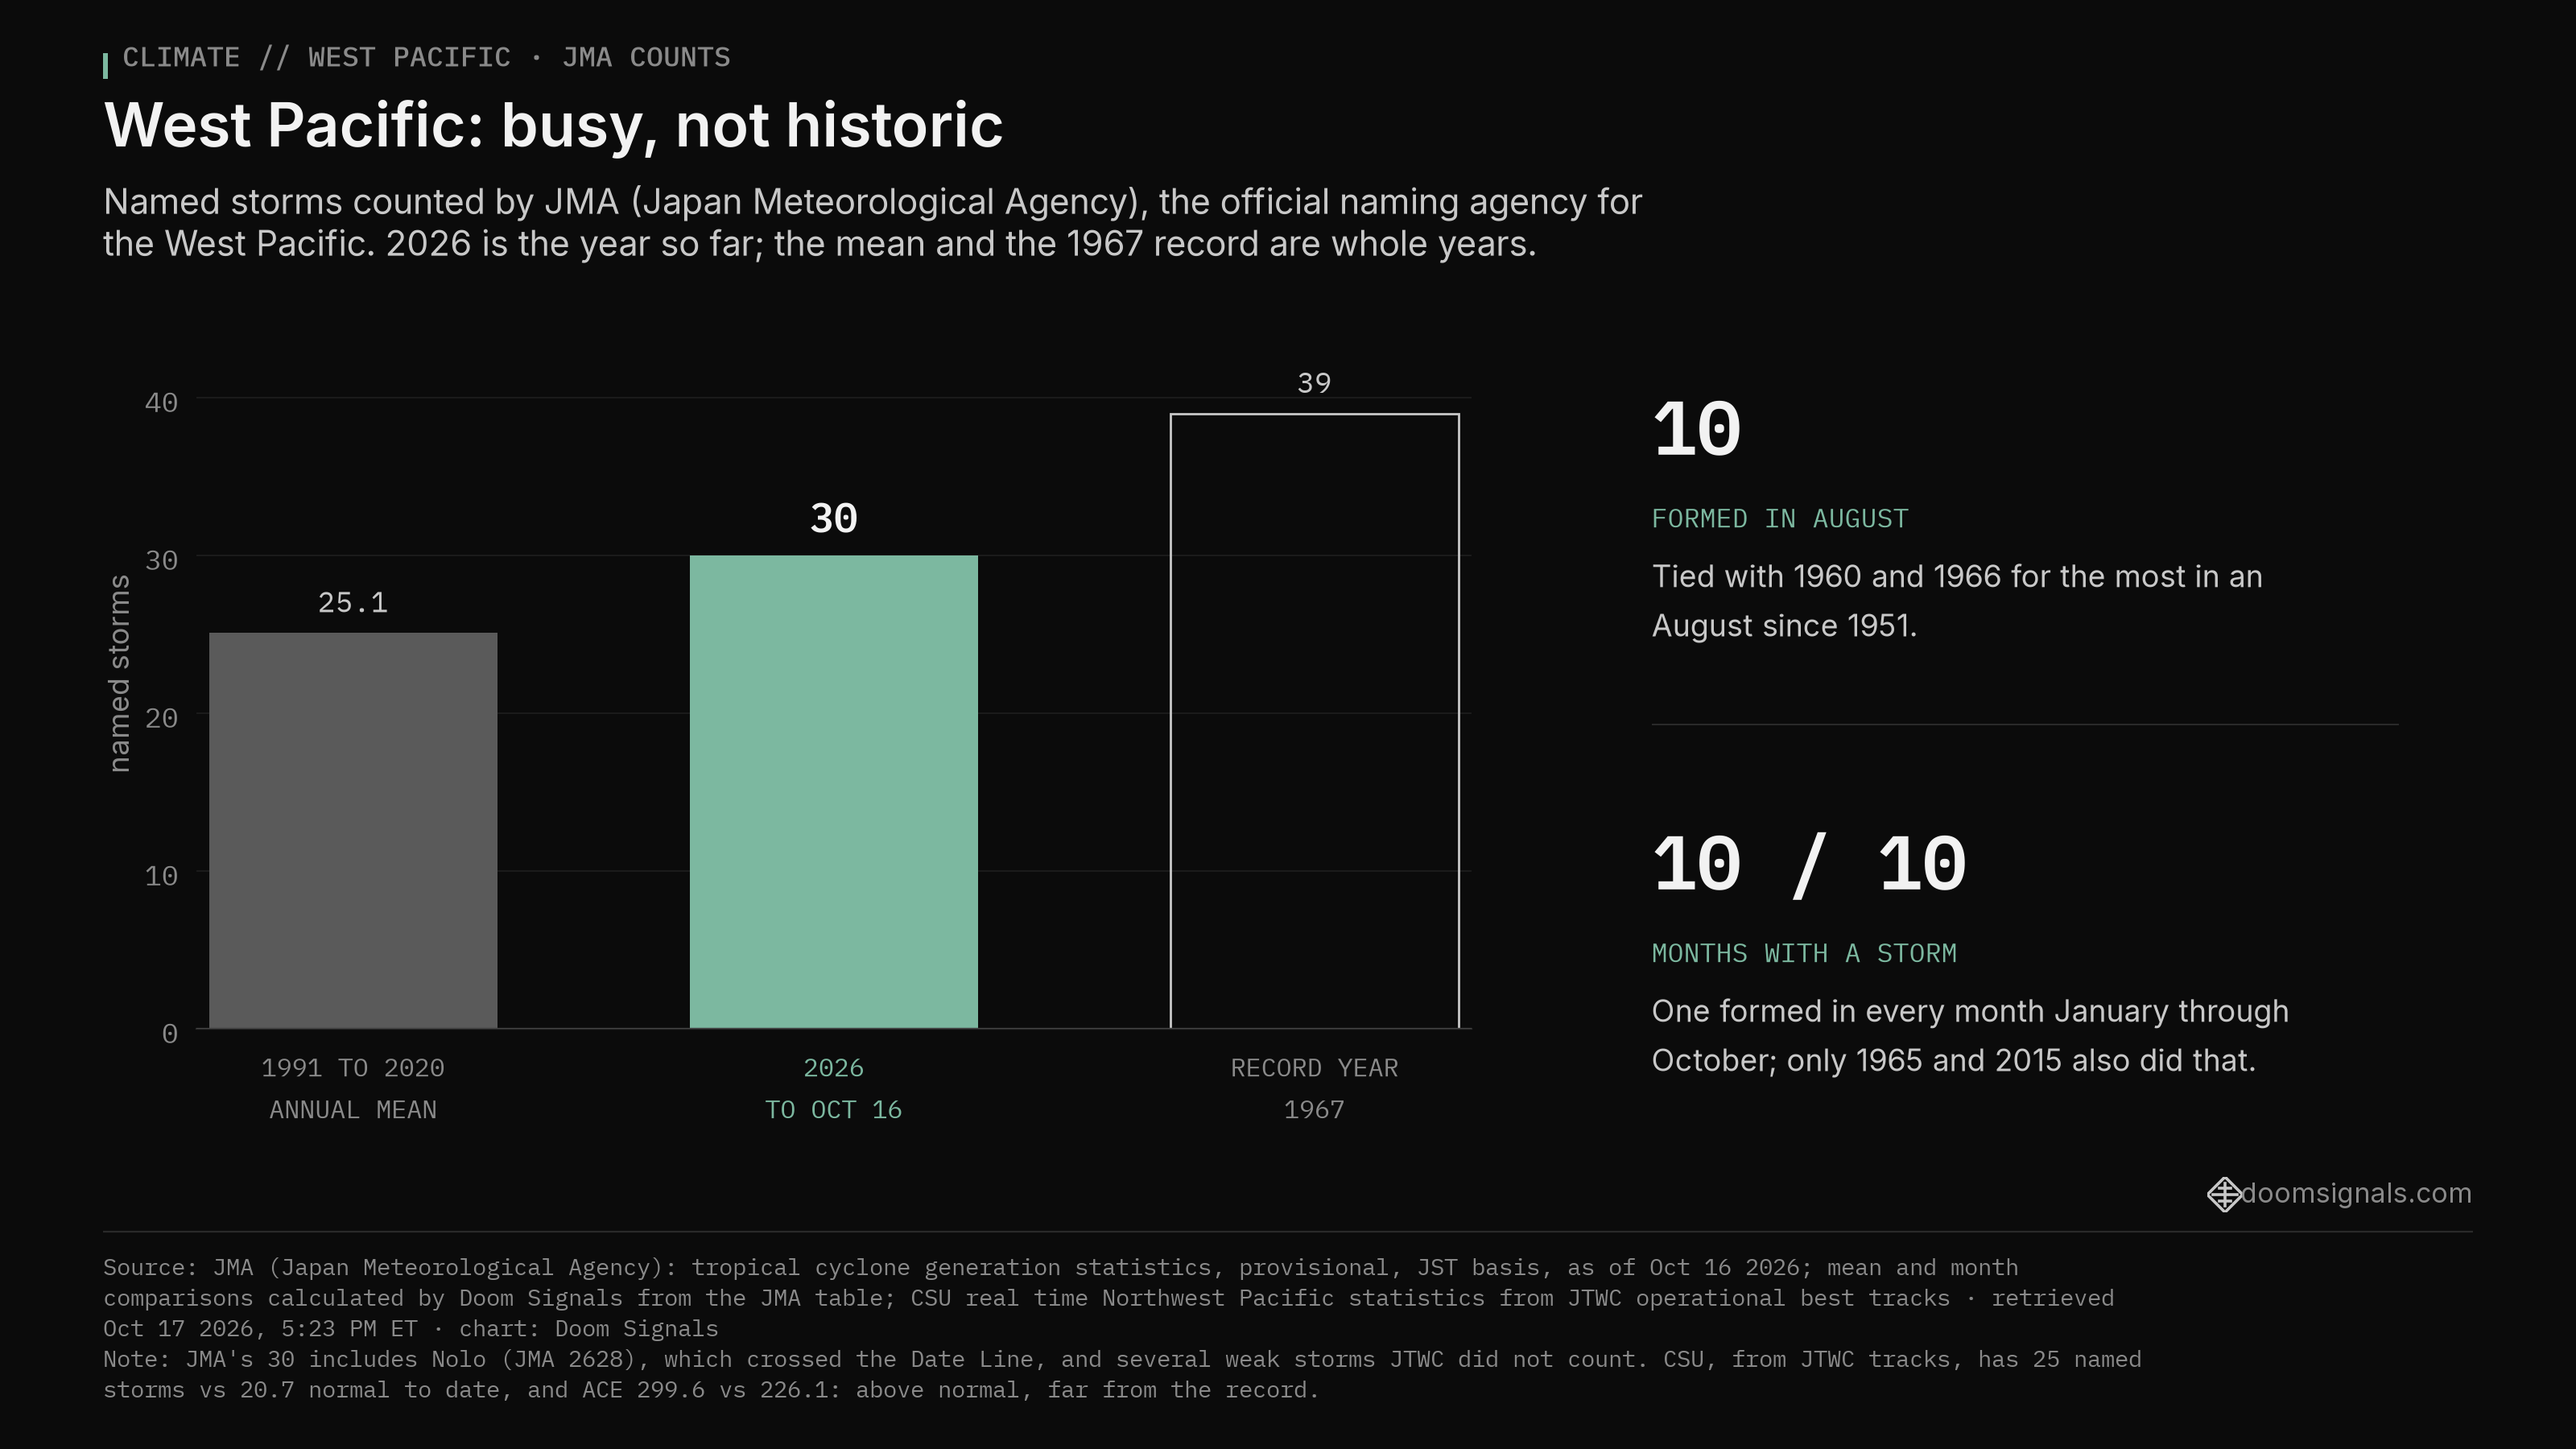
That is a busy year. It is a long way from a historic one. CSU's archive lists 1997 at 570.7 ACE, 2004 at 477.5 and 1992 at 470.1. Earlier this season, JTWC tracked Typhoon Dujuan across the basin in September.
Is 2026 a record year?
Yes for storm energy and hurricane days in the Pacific east of the Date Line taken as a whole; no for storm counts, and no in the West Pacific.
The record is a combined one. CSU's 338.3 for 2026 is above the 318.1 that 2018 set for a full season, and the 72.5 hurricane days are above 2018's 68.25. NOAA's two separate basins are a different story: neither the eastern Pacific nor the central Pacific holds a record on its own. The record only appears when the two are counted together, as one ocean east of the Date Line.
Matthew Rosencrans, NOAA's lead hurricane seasonal forecaster, put the total at 333.2 as of Thursday morning, according to the Honolulu Star-Advertiser, which reported that the season "has blown away" the 2018 record. He explained what the number measures. "The storms extracted that much more energy from the ocean, and they've turned that thermal energy in the ocean into kinetic energy in the wind," Rosencrans told the Star-Advertiser. "ACE is the measurement of that kinetic energy in the wind."
He also tied the season back to the spring outlook. "When we were making the forecast in May, we were looking at a moderate to strong El Nino and that leads to more hurricanes in the Pacific," he said, as reported by the Star-Advertiser. "We have seen that, and now we're seeing it in the numbers."
Some records are not there yet in CSU's records. The named storm days record, 153.75 in 1992, is ahead of 2026's 147.00. The major hurricane days record, 34.75 in 2018, is ahead of 28.25. The most major hurricanes in one season is 11, from 2015, and 2026 has 10, tying 1992 and 2018. With six weeks left, any of those could still move.
For contrast, the Atlantic has been nearly silent. CSU puts its ACE at 18.0, against a normal of 107.8 for this date.
Which storms hit land hardest?
Polo's landfall in Baja California Sur and Hawaii's encounters with Lala and Lowell stand out, though official damage and death counts are still to come.
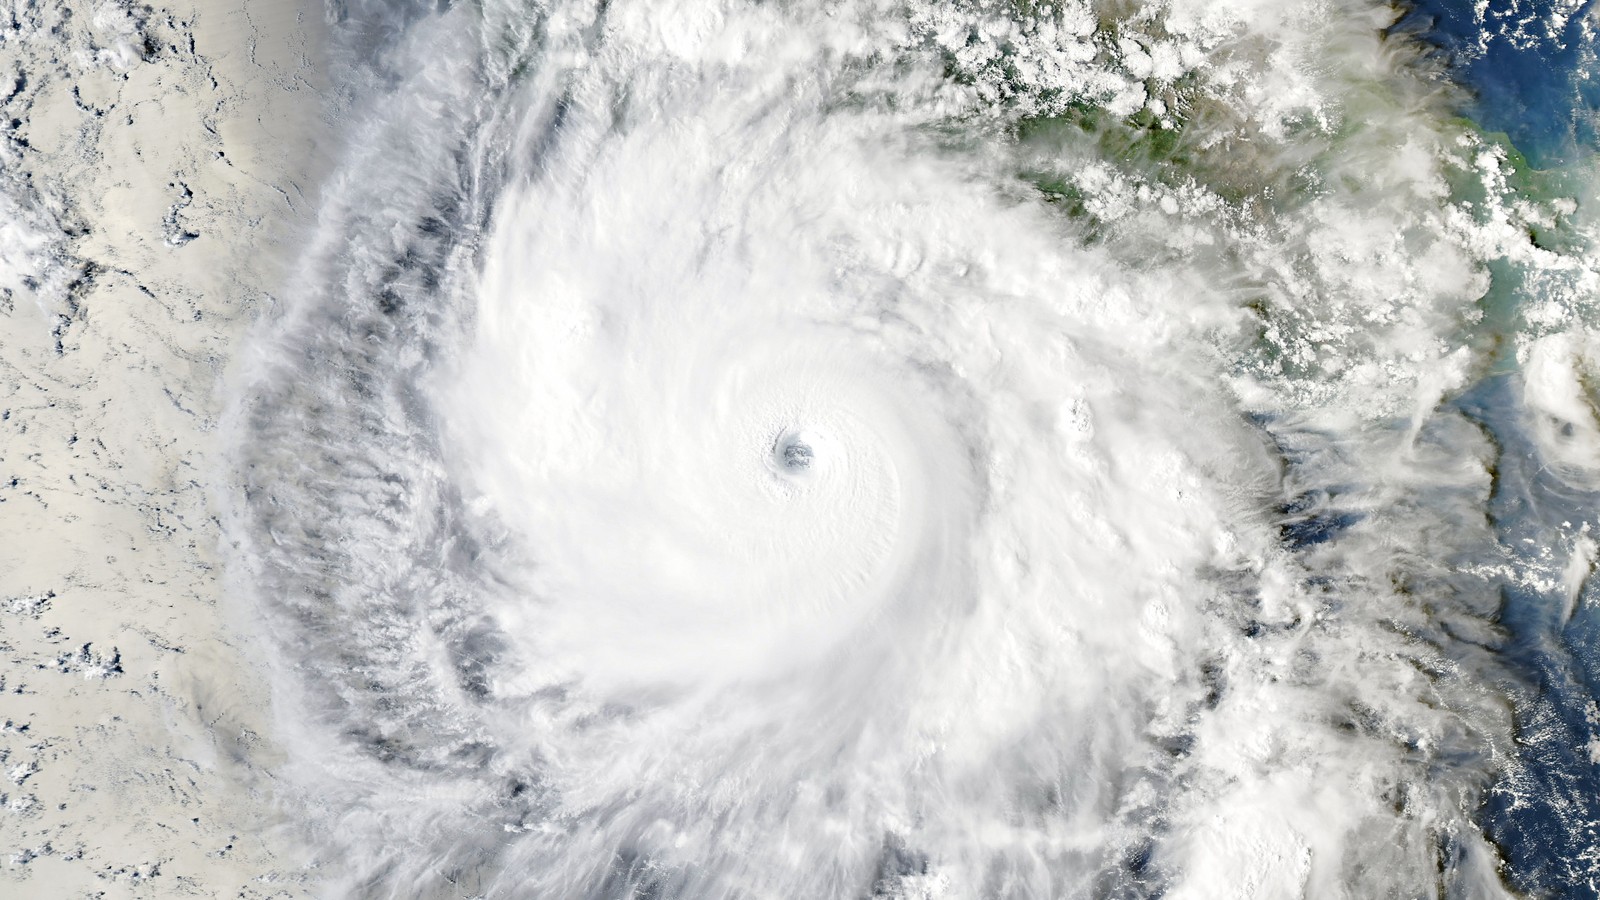
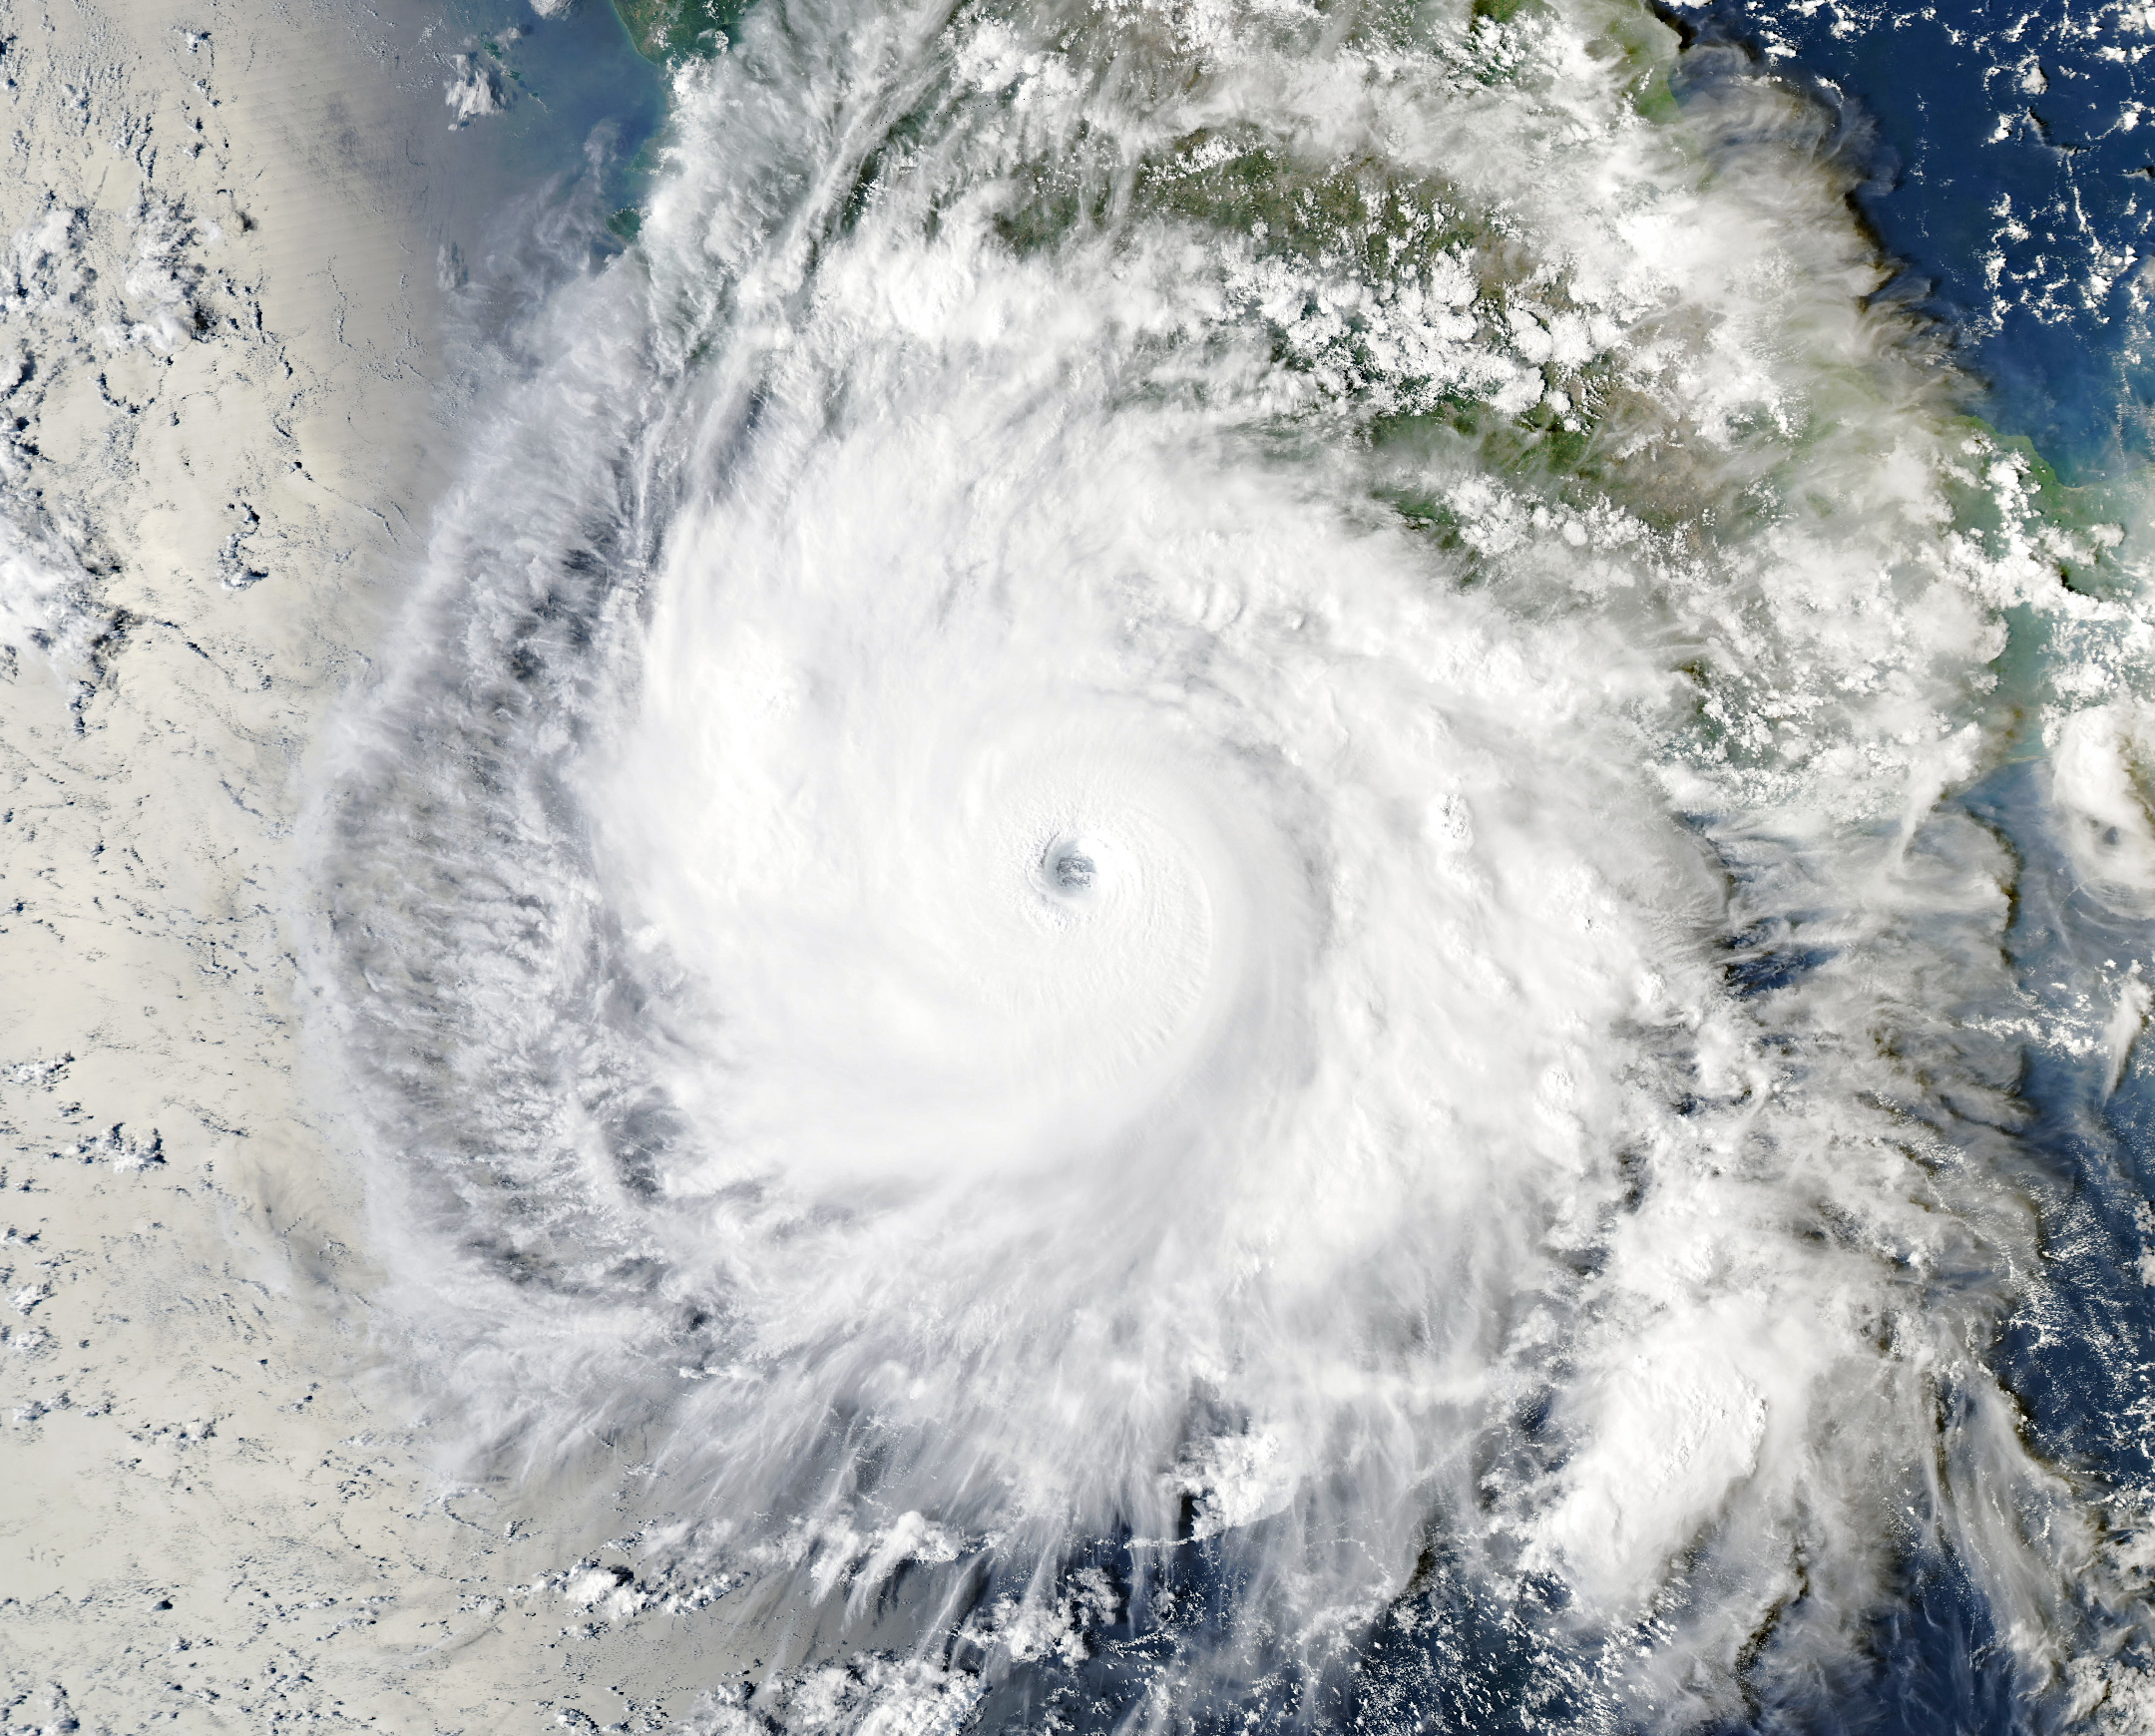
Polo, the storm in the image at the top of this page, peaked near 180 mph with a pressure of 892 mb on Sep 22, according to a National Hurricane Center update based on Hurricane Hunter data. At 11 PM ET on Sep 28, NHC's Advisory 34 said Polo, still a 115 mph hurricane, was about to make landfall in Baja California Sur, with life-threatening winds and flash flooding under way. Its remnants were over northwestern Mexico the next evening.
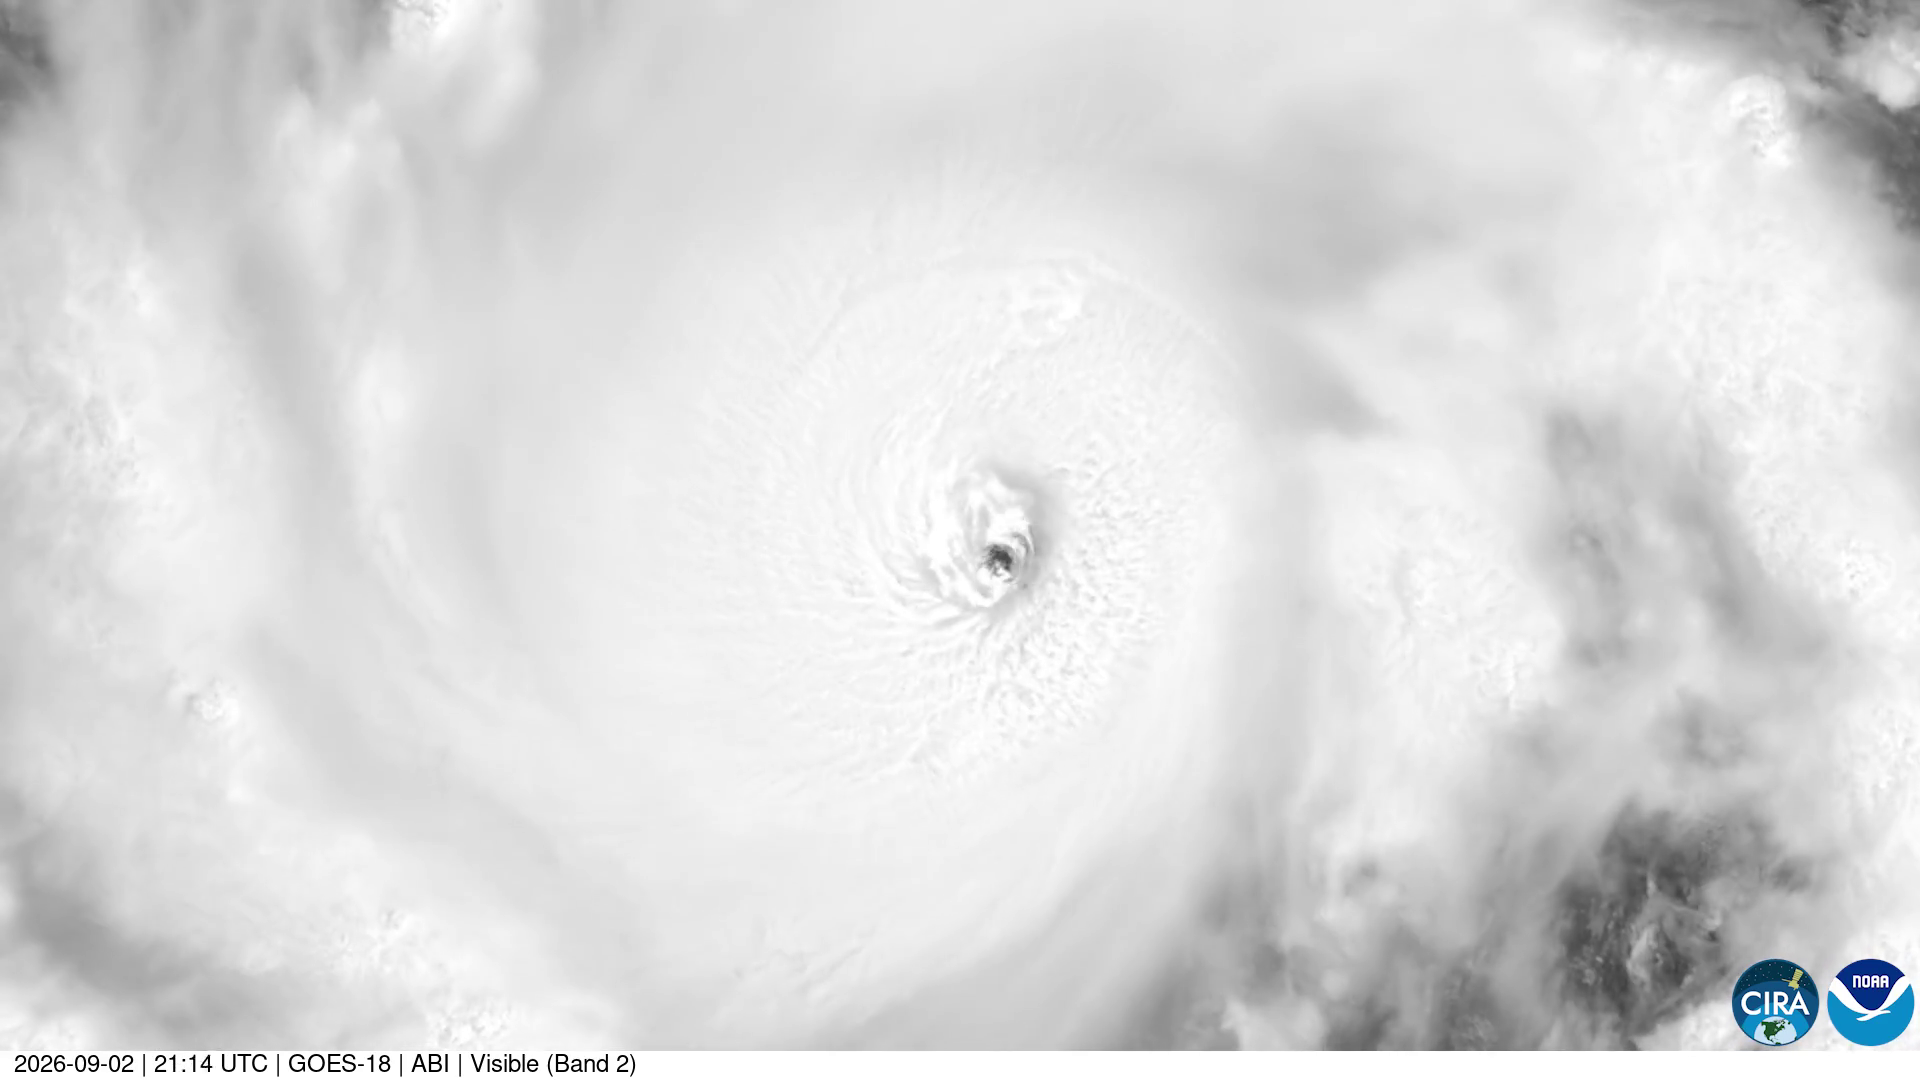
Lowell reached Category 5 on Sep 2, at 160 mph in CPHC's Advisory 26, well south of the islands. In Hawaii, the Central Pacific Hurricane Center put Kauai County under a Tropical Storm Watch on Sep 5 as Category 4 Lowell sat hundreds of miles south southwest of the islands, and NASA caught Lowell, Karina and Marie together in a single view of the Pacific. The Star-Advertiser reported that Hurricane Lala and Hurricane Lowell caused "massive destruction across the state, especially on Hawaii island and Kauai," while Nolo and Tropical Storm Moke came close without severe impacts.
Rachel faded to a post-tropical cyclone and, in NHC's words on Oct 11, brought heavy rains and gusty winds to parts of Baja California and the southwestern United States. Simon dissipated off southern Baja California on Oct 16. Nolo crossed the Date Line as a Category 3 on Oct 4 and became a typhoon on the other side.
The full accounting will come in NHC's tropical cyclone reports, which are written after each season and can take months.
When does the season end?
The eastern and central Pacific seasons run through Nov 30; the West Pacific has no closing date.
NHC says the eastern Pacific season runs from May 15 to Nov 30, and the Central Pacific Hurricane Center's season runs from June 1 to Nov 30. That leaves about six weeks, which is why the ACE figure here will keep moving. Rosencrans and Hawaii State Climatologist Pao-Shin Chu both said the central Pacific could see one or two more hurricanes before the season ends, the Star-Advertiser reported. Typhoons can form in any month, and this year JMA's table shows one in every month so far.
What's active right now (Champi, Trudy)
Super Typhoon Champi is moving away from Guam at 150 mph, per NWS Guam, and Hurricane Trudy is near the coast of west central Mexico at 100 mph, per NHC.
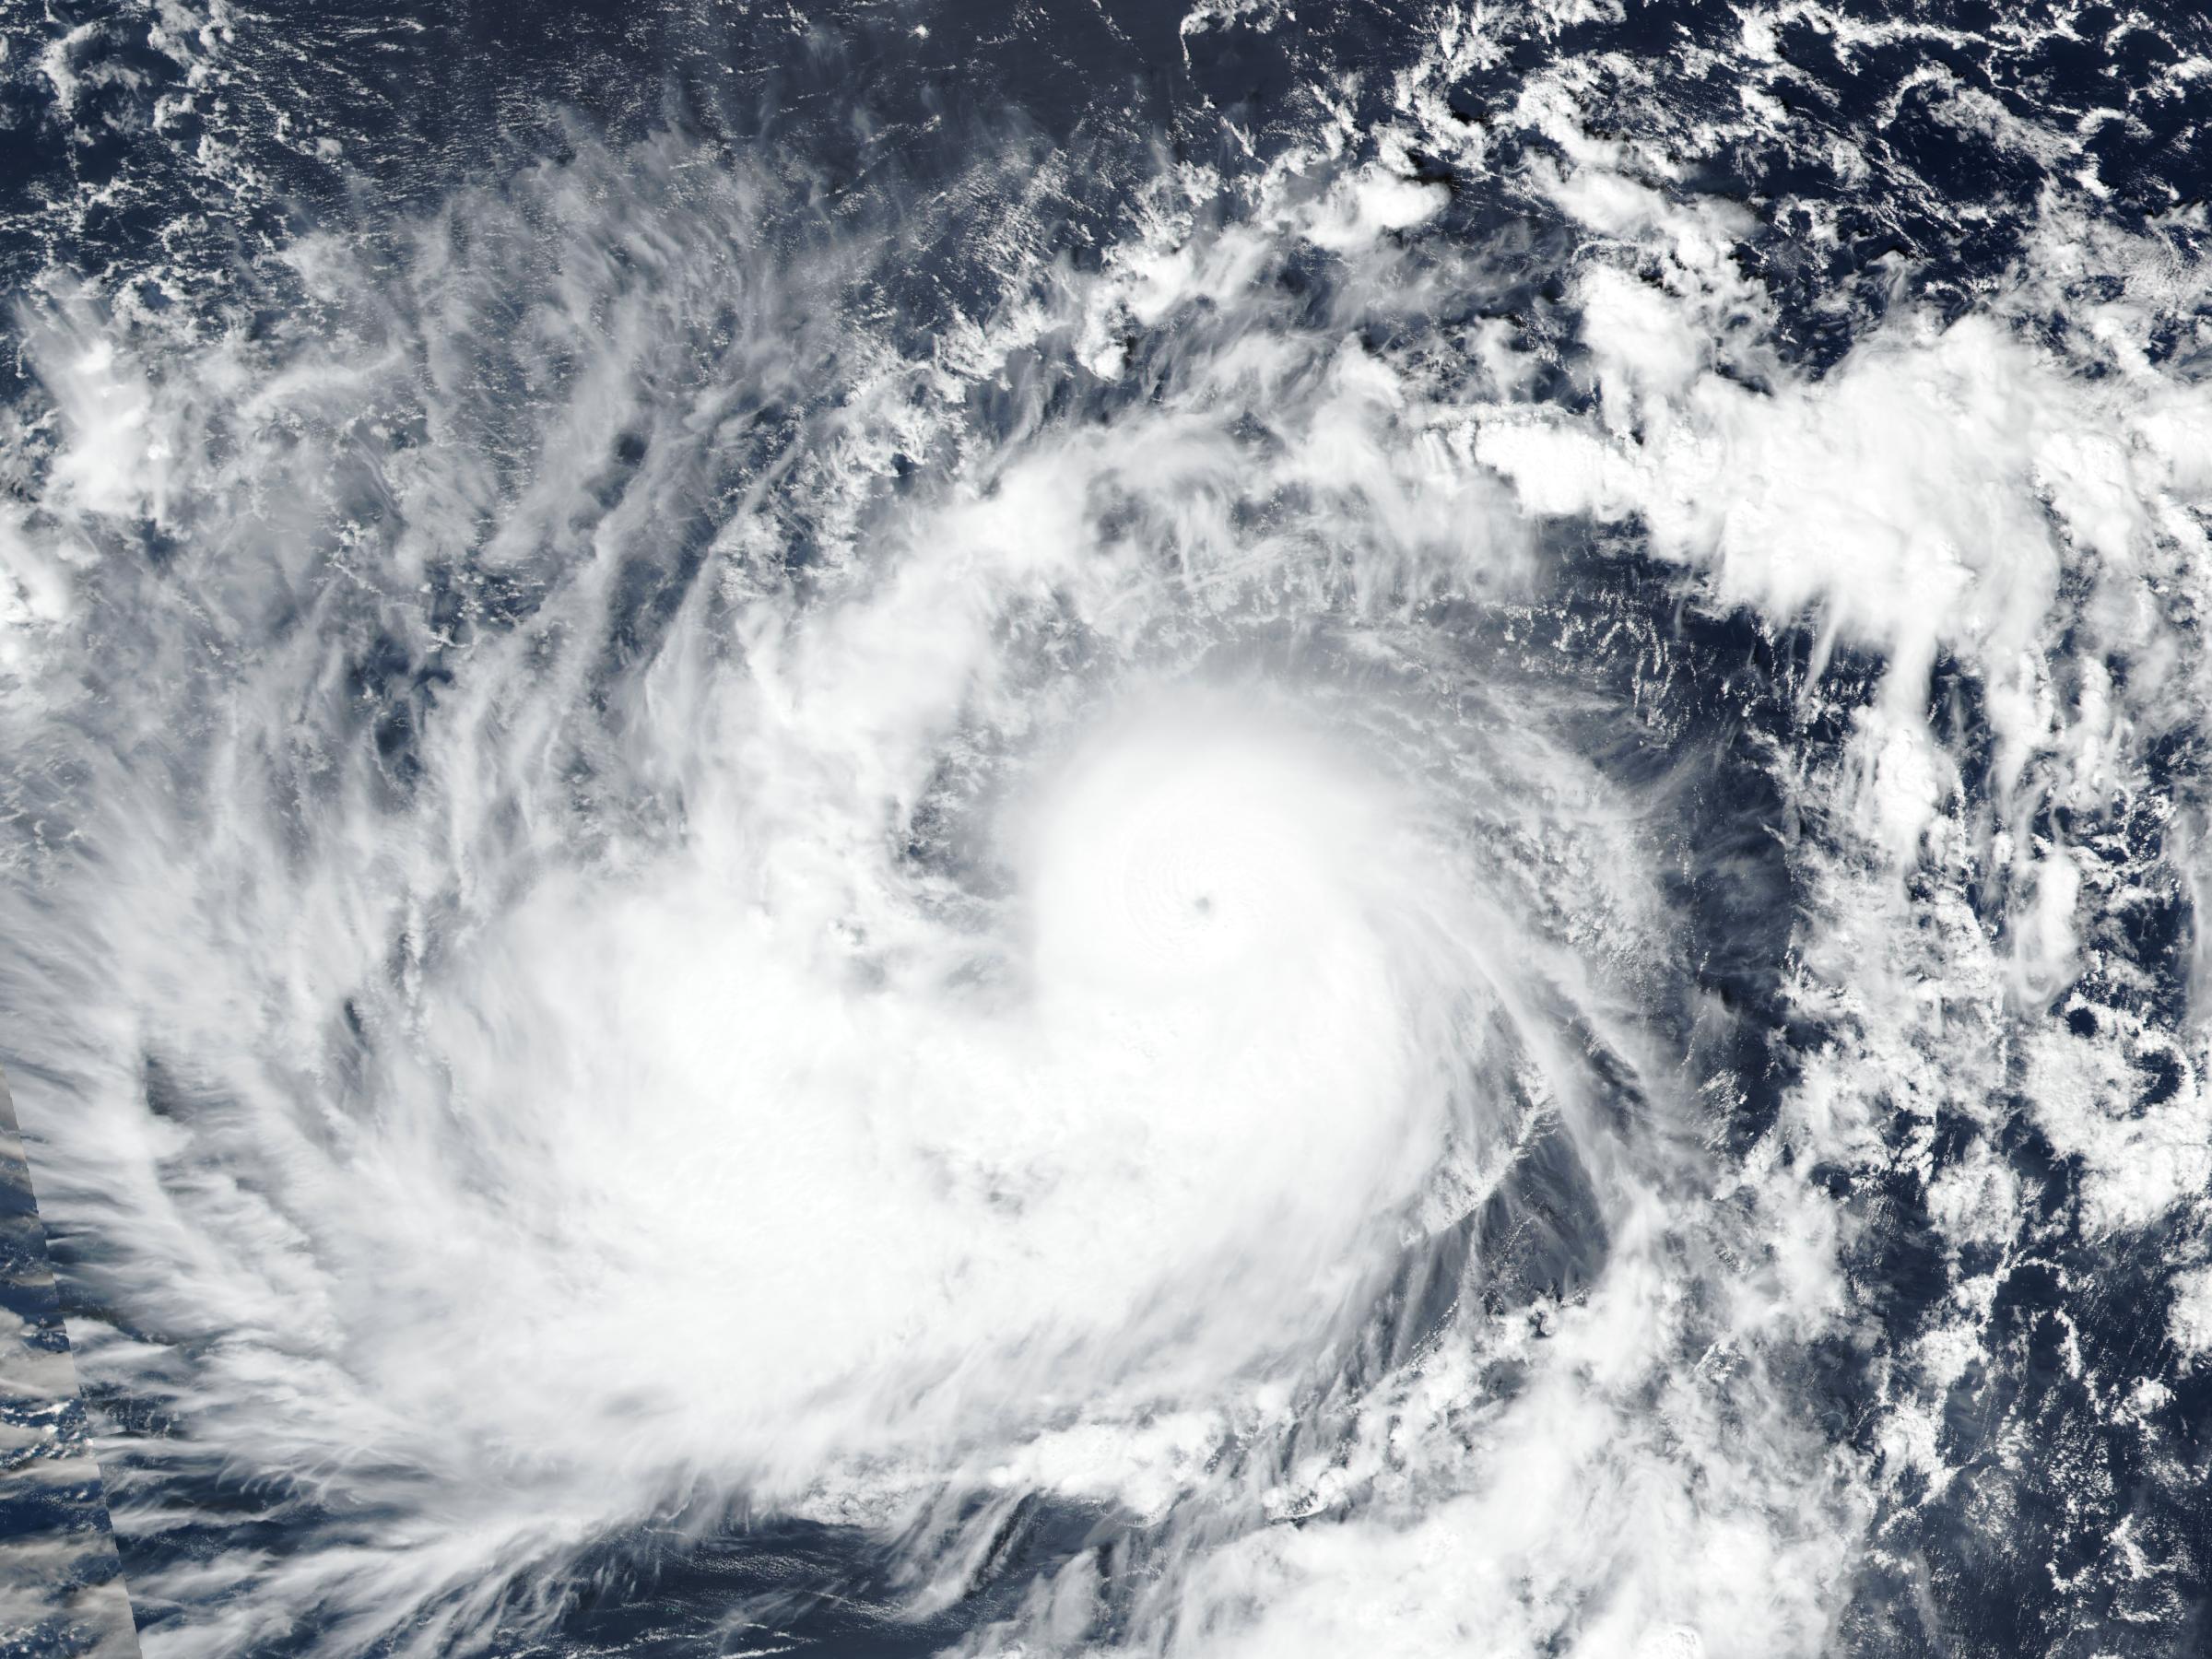
At 5 PM ET, NWS Guam's Advisory 14 put Super Typhoon Champi about 40 miles west southwest of Guam, with maximum sustained winds of 150 mph, moving west northwest at 16 mph. A Typhoon Warning remains in effect for Guam and Rota, with a Tropical Storm Warning and a Typhoon Watch for Tinian and Saipan. NWS Guam said Champi could reach Category 5 around late Monday morning Chamorro time as it moves away from the Marianas. The Joint Typhoon Warning Center's Warning 14 also rates it a super typhoon, with one minute winds of 130 knots, about 150 mph, and says the center passed roughly 10 nautical miles south of Guam.
At the same hour, NHC's Advisory 18 put Hurricane Trudy about 115 miles south southwest of Manzanillo, with 100 mph winds and a pressure of 976 mb. A Hurricane Warning covers the coast of Mexico from Manzanillo north to Cabo Corrientes, and NHC expects Trudy to pass near the coast tonight and Sunday, with 4 to 8 inches of rain and up to 12 inches in spots in Michoacán, Colima and Jalisco.
Live numbers sit on our hurricanes page, which follows every storm on the board.
Sources
Every figure on this page comes from the agencies and records below, checked between 5 PM and 5:30 PM ET on Oct 17, 2026.
- Colorado State University, Real-time tropical cyclone statistics, Northeast Pacific and Northwest Pacific, updated 5 PM ET Oct 17, 2026
- Colorado State University, Northeast Pacific historical statistics, 1949 to 2025
- Colorado State University, Northeast Pacific 2026 statistics by storm
- National Hurricane Center, 2026 eastern Pacific season table and central Pacific season table
- National Hurricane Center, Hurricane Polo Tropical Cyclone Update, Sep 22, 2026, and Advisories 34 and 35, Sep 28 and 29, 2026; Post-Tropical Cyclone Rachel Advisory 57, Oct 11, 2026; Remnants of Simon Advisory 38, Oct 16, 2026; Hurricane Trudy Advisory 18, 5 PM ET Oct 17, 2026
- Central Pacific Hurricane Center and NHC, Hurricane Lowell Advisory 40, Sep 5, 2026
- NWS Guam, Super Typhoon Champi Advisory 14, 7:17 AM ChST Oct 18 (5:17 PM ET Oct 17), 2026
- Joint Typhoon Warning Center, Super Typhoon 29W (Champi) Warning 14 and prognostic reasoning, 5 PM ET Oct 17, 2026
- National Hurricane Center, Tropical cyclone climatology (season dates)
- Japan Meteorological Agency, Typhoon generation statistics (provisional)
- NOAA Climate Prediction Center, 2026 eastern Pacific hurricane outlook; NWS Central Pacific Hurricane Center, 2026 central Pacific outlook
- Images: NASA Earth Observatory, Explosive Intensification for Hurricane Polo (Aqua MODIS, Sep 23, 2026); NOAA NESDIS, 2026 hurricane season media gallery (GOES-18, Lowell); NASA Worldview (Suomi NPP VIIRS, Champi)
- Central Pacific Hurricane Center, Hurricane Lowell Advisory 26, 11 AM HST Sep 2, 2026
- Honolulu Star-Advertiser, "Ongoing Pacific hurricane season already setting records," Oct 17, 2026, as published by the Hawaii Tribune-Herald
Sources: Colorado State University real-time and historical tropical cyclone statistics; National Hurricane Center; Central Pacific Hurricane Center; NWS Guam; Joint Typhoon Warning Center; Japan Meteorological Agency; NOAA Climate Prediction Center; Honolulu Star-Advertiser. Hero image: NASA Earth Observatory images by Michala Garrison, using sea surface temperature data from the Multiscale Ultrahigh Resolution (MUR) project, MODIS data from NASA EOSDIS LANCE and GIBS/Worldview, and storm track data from NOAA's National Hurricane Center. Charts: Doom Signals, from CSU and JMA data. Lowell image: NOAA, CSU/CIRA. Champi image: NASA Worldview, part of NASA ESDIS. Figures as of 5:46 PM ET, October 17, 2026.