
On October 1, a young lab worker at the Irkutsk Anti-Plague Institute died of severe pneumonia in the town of Shelekhov, according to Russian media. Within a day the word "plague" was everywhere. The Irkutsk governor called it "a suspected case of a particularly dangerous infection." The head of neighbouring Buryatia posted that she had "died of plague," then edited it to "possibly." Stories about pneumonic plague, a broken test tube and nearly 200 people in hospital spread fast, all from unnamed sources.
On October 4, Rospotrebnadzor, Russia's consumer health and disease agency, said the diagnosis was "pneumonia of unknown etiology." Its statement, carried by Interfax, said no microorganisms linked to her work were found, no lab accident had happened, and testing of contacts turned up two Covid cases and two rhinovirus cases. It called the situation stable. The statement does not use the word plague. The cause of death is still officially unknown. Our note on that arc is on the board: doomsignals.com/notes/fracture-irkutsk-plague-scare-rospotrebnadzor-pneumonia-unknown-cause-2026-10-04.
While that played out, a second story was riding along in the replies: the Sun is going quiet, a "grand solar minimum" is coming, and grand minima bring cold, famine and plague. The Little Ice Age, the Black Death and the Great Plague of London get stacked into one neat chain.
I wanted to know how much of that chain holds, so I pulled the long records and graded each link.
Short version: some links are strong, some are contested, and the one that ties the Sun directly to plague has no peer-reviewed support that I could find.
1. The Sun's quiet spells are real
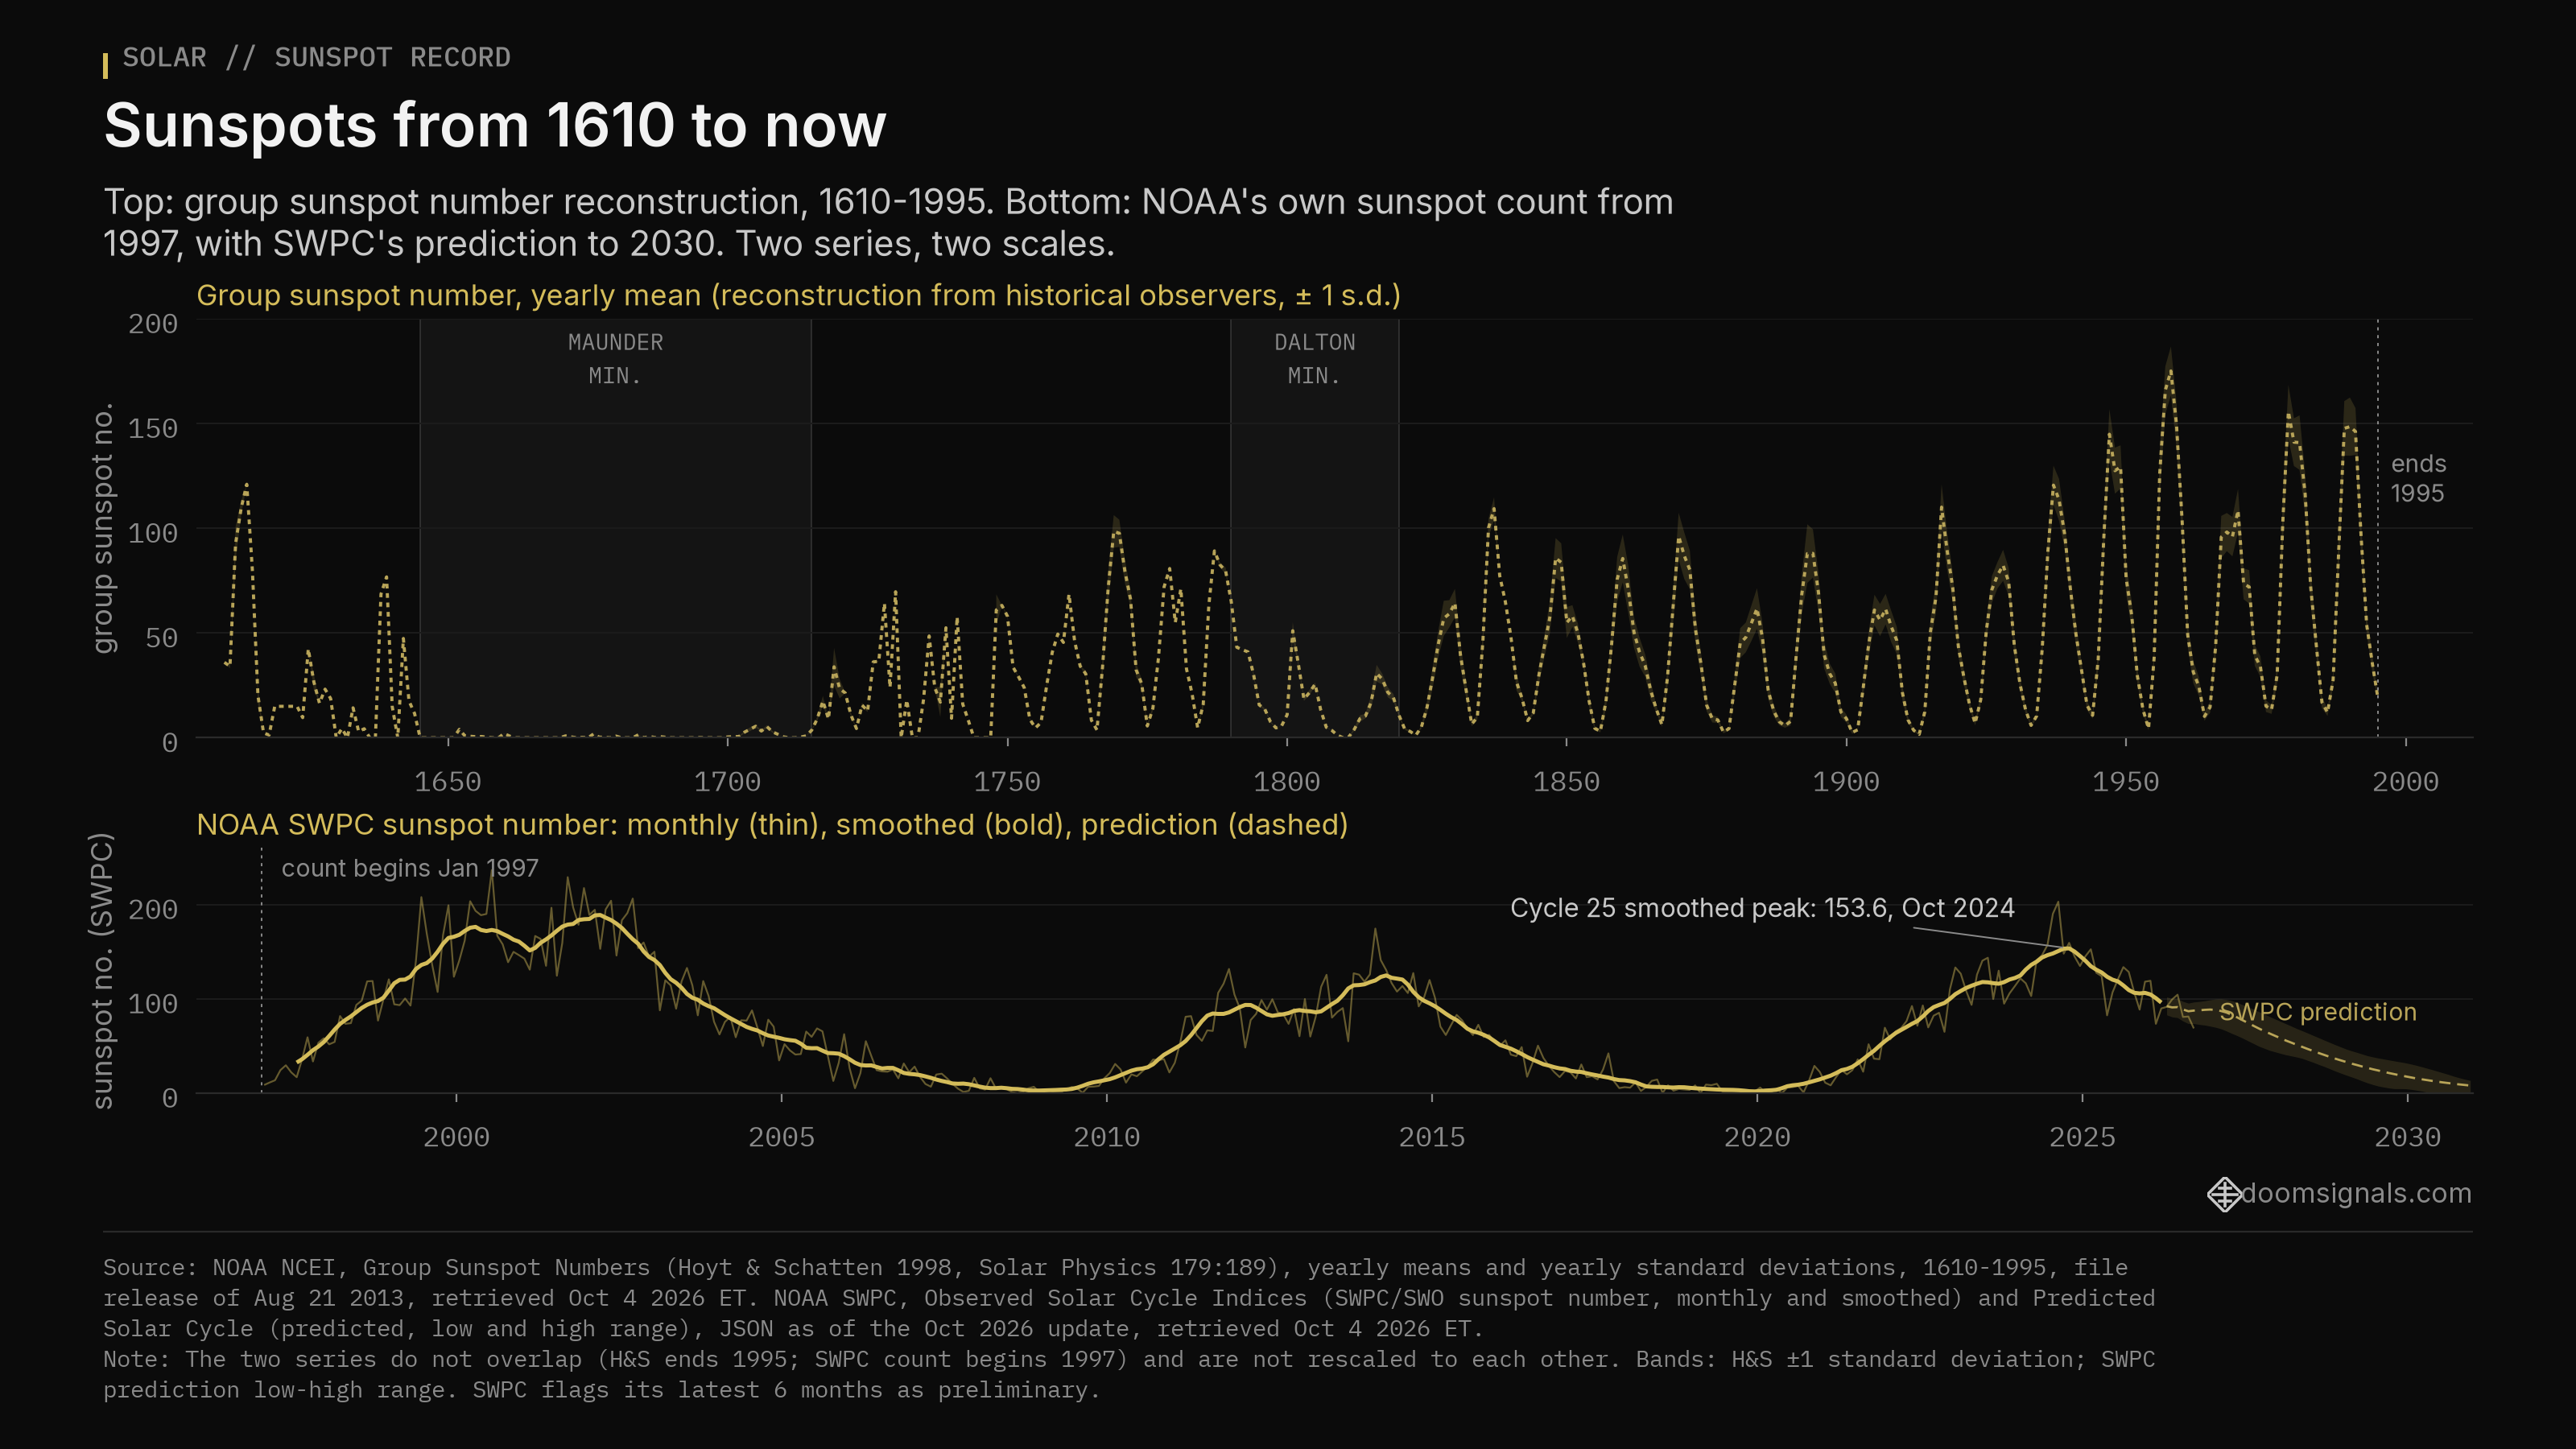
NOAA hosts the Hoyt and Schatten group sunspot number for 1610 to 1995 (Solar Physics, 1998, doi:10.1023/A:1005007527816), which NOAA's documentation says draws on 463 historical observers, and its Space Weather Prediction Center keeps its own count from 1997. The two use different scales, so the chart keeps them in separate panels.
In the top panel of the chart at the head of this page, the line is nearly flat from 1645 to 1715. That is the Maunder Minimum, named by John Eddy in a 1976 paper in Science (doi:10.1126/science.192.4245.1189). In the Hoyt and Schatten file, the yearly value averages 0.69 across those 71 years and 36 of the 71 years are recorded as zero.
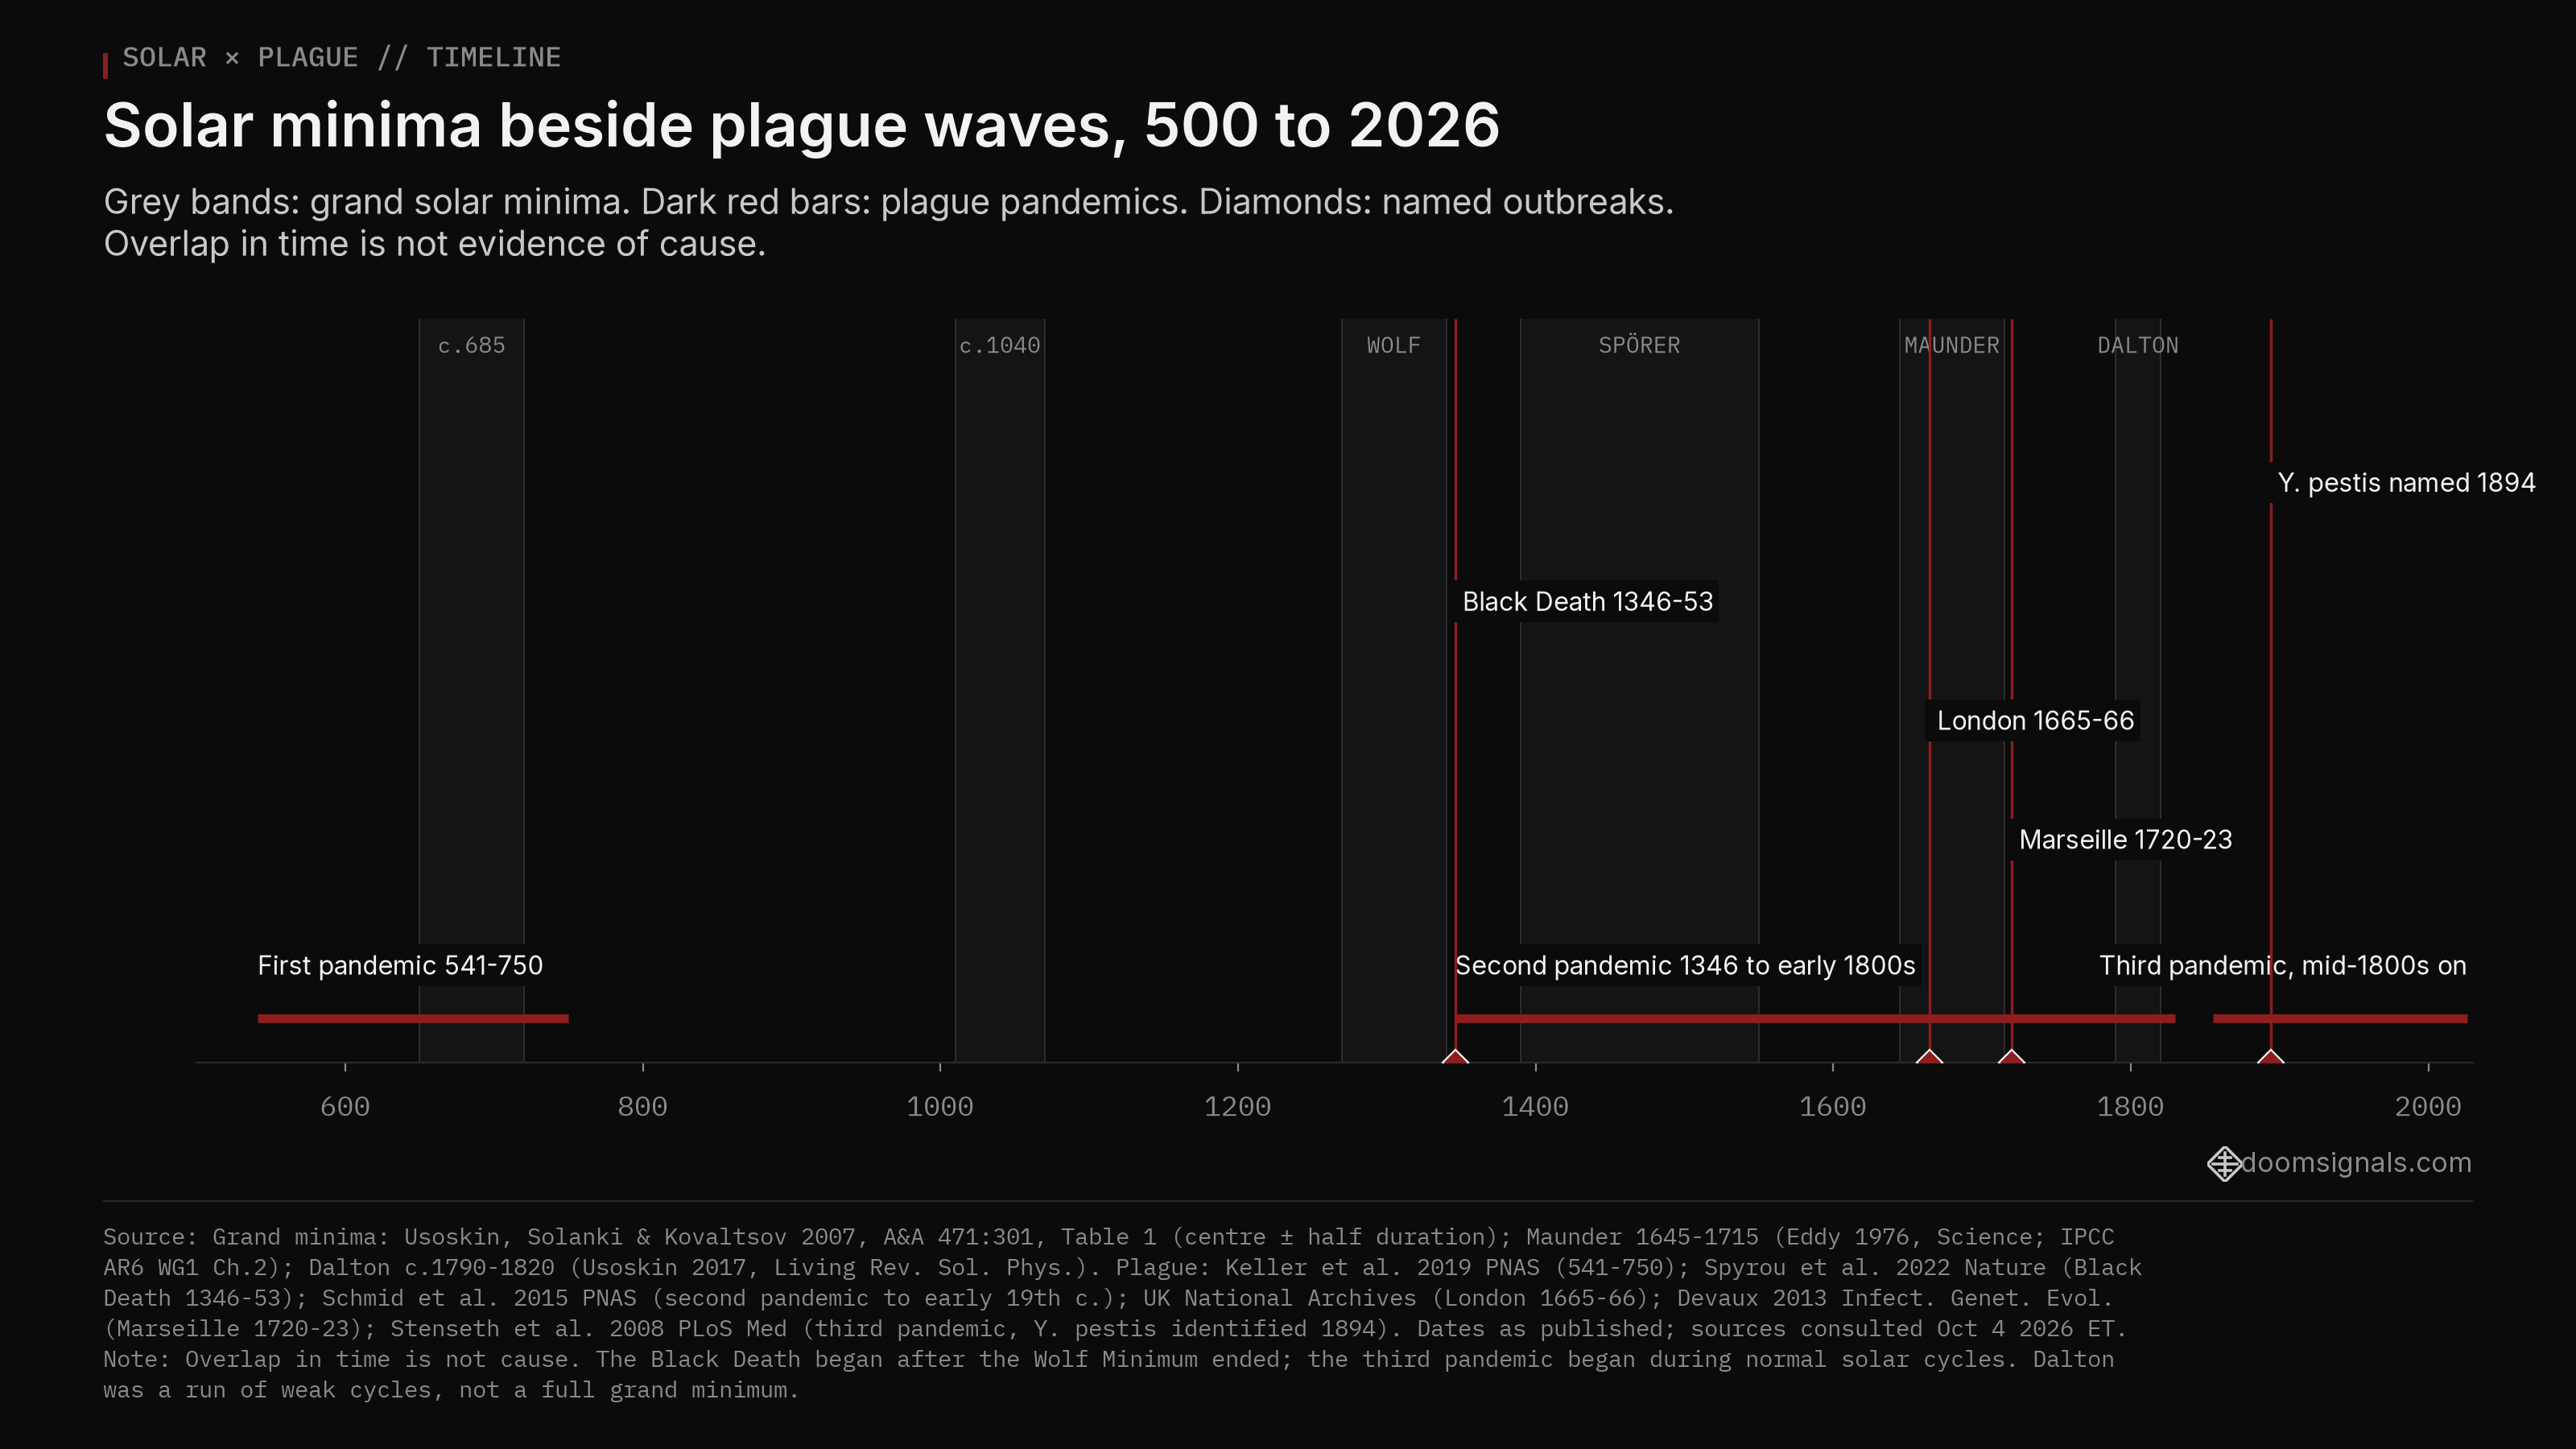
Earlier quiet spells show up in cosmogenic isotopes, the carbon-14 and beryllium-10 that cosmic rays make and that end up in tree rings and ice. Ilya Usoskin, Sami Solanki and Gennady Kovaltsov (Astronomy and Astrophysics, 2007, 471:301) list grand minima centred near 685, 1040, 1305 (the Wolf Minimum), 1470 (the Spörer Minimum) and 1680 (the Maunder). They estimate the Sun spends about 17 percent of its time in such states. Usoskin's 2017 review in Living Reviews in Solar Physics (doi:10.1007/s41116-017-0006-9) puts the Spörer at roughly 1450 to 1550 and the Wolf in the 14th century, and describes the Dalton Minimum, about 1790 to 1820, as a period of weak cycles rather than a true grand minimum.
Grand minima are well documented and they recur. The open questions are when the next one comes and what it would do.
The timeline below puts those quiet spells beside the plague waves. More on it in section 3.
2. The cold centuries
The Little Ice Age is the usual name for a few centuries of cooler conditions, especially in the Northern Hemisphere, between the late Middle Ages and the 1800s. Different studies date it differently. NOAA's Climate.gov puts its strongest phase at about 1450 to 1850. Mathew Owens and colleagues (Journal of Space Weather and Space Climate, 2017, doi:10.1051/swsc/2017034) use about 1440 to 1920 for the Northern Hemisphere.
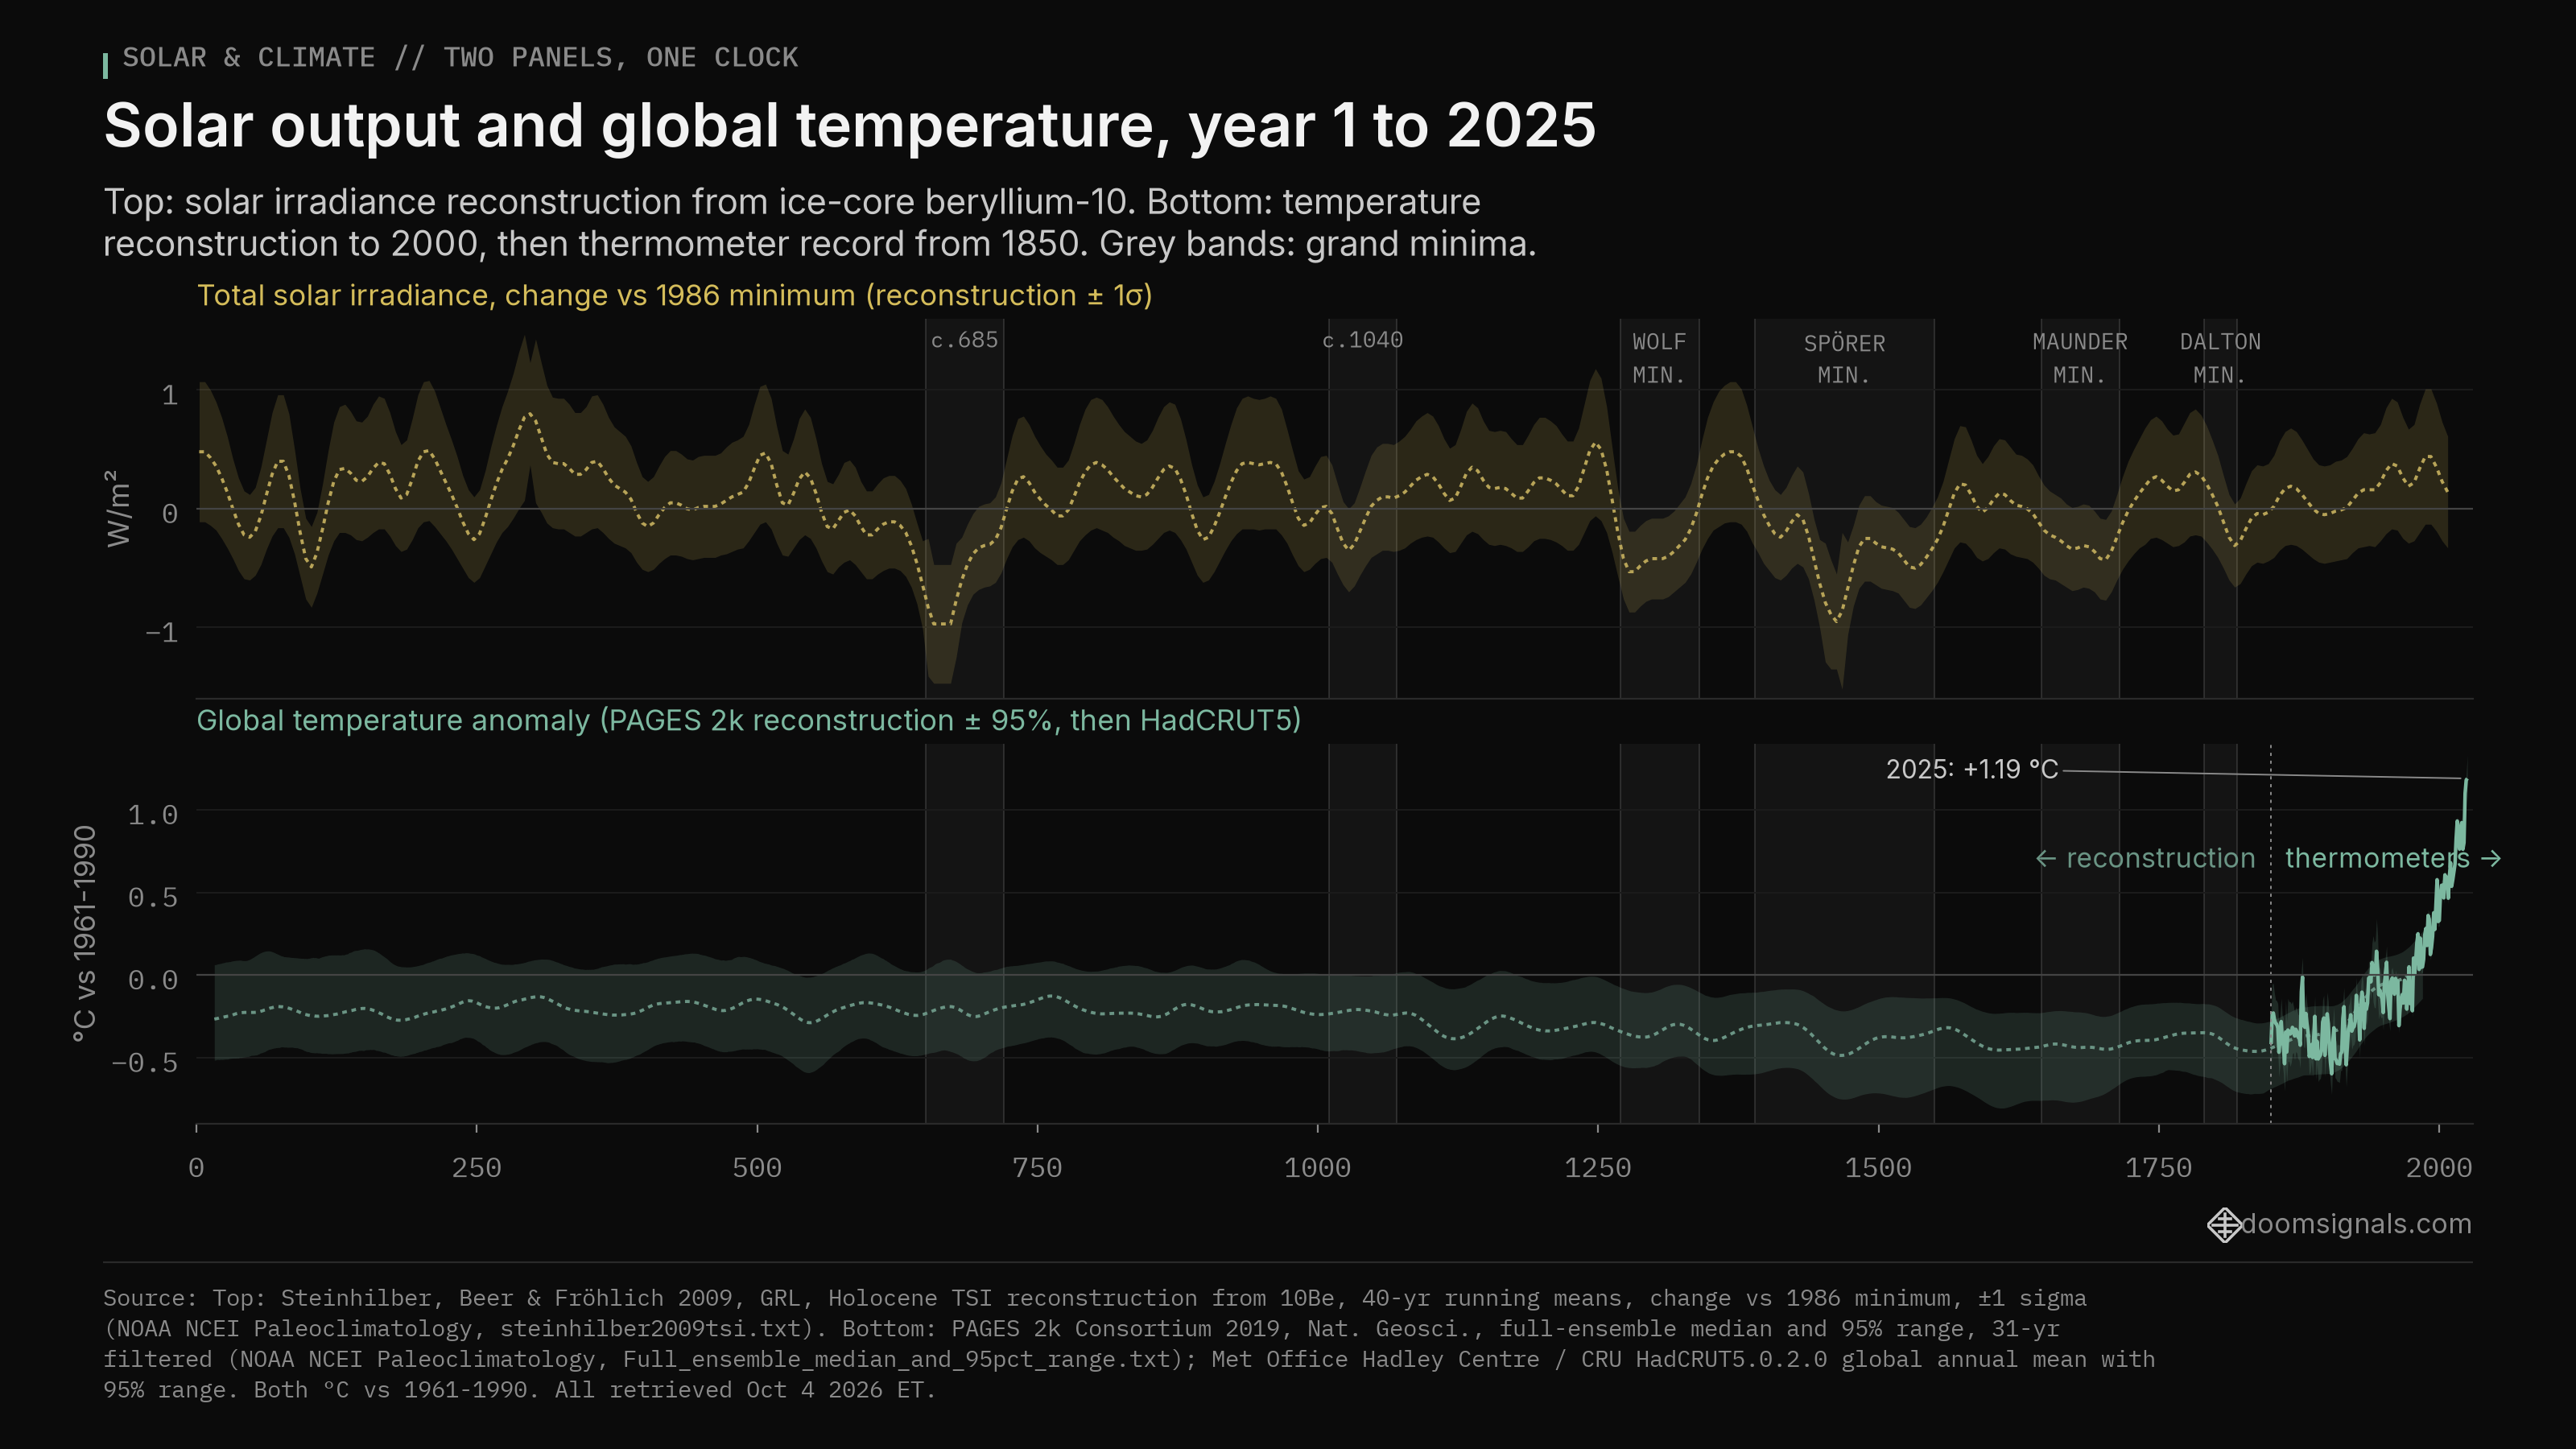
The chart above stacks two long records on one time axis. On top is total solar irradiance rebuilt from ice-core beryllium-10 by Friedhelm Steinhilber, Jürg Beer and Claus Fröhlich (Geophysical Research Letters, 2009, doi:10.1029/2009GL040142). Below it is the PAGES2k Consortium's global mean temperature reconstruction (Nature Geoscience, 2019, doi:10.1038/s41561-019-0400-0), built from hundreds of tree-ring, coral, ice and sediment records, joined to the HadCRUT5 instrumental record from the Met Office Hadley Centre and the University of East Anglia (Morice et al. 2021, doi:10.1029/2019JD032361).
In the PAGES2k median, the coldest 31-year stretch before 1850 sits around 1466, inside the Spörer Minimum, at about 0.49 °C below the 1961 to 1990 average. The Maunder years average about 0.46 °C below it. In HadCRUT5, 2025 came in about 1.19 °C above that same baseline. In Steinhilber's series, solar output during the Maunder averaged about 0.3 watts per square metre below the 1986 solar minimum. That is a change of a few hundredths of one percent.
So did the quiet Sun cause the cold? Here the literature mostly says: partly at most, and probably not much.
- Owens and colleagues (2017) conclude that the timing of the Maunder Minimum and the Little Ice Age is "not suggestive of causation" and should not, on its own, be used as evidence of significant solar forcing of climate. They point to volcanic activity as crucial and put the contribution of reduced solar output on a par with changes in land use.
- Andrew Schurer and colleagues (Nature Geoscience, 2014, doi:10.1038/ngeo2040) found that solar forcing probably had only a minor effect on Northern Hemisphere temperature over the past 1,000 years, with volcanoes and greenhouse gases doing most of the work.
- Gifford Miller and colleagues (Geophysical Research Letters, 2012, doi:10.1029/2011GL050168) dated the Little Ice Age's onset to 1275 to 1300 and an intensification to 1430 to 1455, both tied to clusters of large eruptions, and found that large changes in solar output were not required to explain it.
- Raphael Neukom and colleagues (Nature, 2019, doi:10.1038/s41586-019-1401-2) found no globally coherent cold or warm epochs in the preindustrial era. The coldest stretch of the Little Ice Age came in different centuries in different regions: the 1400s in the central and eastern Pacific, the 1600s in northwestern Europe and southeastern North America, and the mid-1800s in most other places. The 20th century, by contrast, was the warmest of the past 2,000 years for more than 98 percent of the globe.
- NOAA's Climate.gov notes that the Maunder Minimum only partly overlapped the Little Ice Age and that the cold "began well before" it.
The quiet Sun probably nudged things, especially regional winters. But the cold centuries make more sense as a mix of volcanic eruptions, ocean and sea-ice feedbacks, natural variability and some solar dimming than as a direct result of the Maunder Minimum.
3. Plague's three pandemics
Plague is caused by the bacterium Yersinia pestis. It normally lives in wild rodents and their fleas. People get it from flea bites, from handling infected animals or, in the pneumonic form, from each other through the air. Historians and geneticists recognise three great pandemics.
The first pandemic (541 to about 750). It began with the Plague of Justinian. Ancient-DNA work by Marcel Keller and colleagues (PNAS, 2019, doi:10.1073/pnas.1820447116) confirmed Yersinia pestis in victims across Europe and traced its diversity over two centuries.
The second pandemic (1346 to the early 1800s). It opened with the Black Death of 1346 to 1353, which WHO says caused more than 50 million deaths in Europe. Maria Spyrou and colleagues (Nature, 2022, doi:10.1038/s41586-022-04800-3) traced the strain that seeded it to the Tian Shan mountains near Lake Issyk-Kul in present-day Kyrgyzstan, where gravestones record a lethal outbreak in 1338 and 1339. The second pandemic kept coming back for four centuries. The Great Plague of London in 1665 and 1666 "may have killed more than 100,000 Londoners," according to the UK National Archives. In Marseille in 1720, plague arrived on the ship Grand Saint Antoine and killed about 30 percent of the city's inhabitants by 1723 (Devaux 2013, Infection, Genetics and Evolution, doi:10.1016/j.meegid.2012.11.016). A 2026 PNAS study from Keller and colleagues (doi:10.1073/pnas.2534899123), which we covered on the board, added 26 genomes from 11 European sites dating from 1349 to 1710 and tied 75 genomes in total to documented outbreaks.
The third pandemic (mid-1800s onward). It began in China and spread worldwide through ports in the 1890s. In 1894, in Hong Kong, Alexandre Yersin identified the bacterium that now carries his name (Stenseth et al., PLoS Medicine, 2008, doi:10.1371/journal.pmed.0050003). The cases WHO counts today are its tail end.
Look back at the timeline in section 1 and you can see why the solar story is tempting. The Maunder Minimum overlaps the London plague and comes close to Marseille. But the overlaps do not hold up. The Black Death began after the Wolf Minimum had ended. The Spörer Minimum covers a century with plague but no single standout wave. The third pandemic took off in the 1890s, when the Sun was cycling normally. The second pandemic ran for about 450 years, so it was bound to overlap whatever grand minima happened in that window. On their own, the dates don't show cause.
4. Where climate and plague really do connect
This is the strongest part of the story, and it runs through rodents and fleas, not sunspots.
In the deserts of Kazakhstan, great gerbils carry plague in a natural cycle. Nils Chr. Stenseth and colleagues (PNAS, 2006, doi:10.1073/pnas.0602447103) used field data from 1949 to 1995 from a plague focus southeast of Lake Balkhash and found that plague prevalence in the gerbils rises with warmer springs and wetter summers. Their model predicts that a 1 °C warmer spring raises prevalence by more than 50 percent. Kyrre Kausrud and colleagues (BMC Biology, 2010, doi:10.1186/1741-7007-8-112) built climate-driven models of the gerbil and flea system that predicted human plague cases in Kazakhstan from 1904 to 1948 and fit the broad historical record over about 1,500 years. The mechanism is simple: good weather means more food, more gerbils, more fleas and more spillover.
Boris Schmid and colleagues (PNAS, 2015, doi:10.1073/pnas.1412887112) went further. They compared 7,711 historical plague outbreaks in Europe with 15 tree-ring climate records from Europe and Asia. Their finding: plague seems to have been reintroduced into European ports again and again from Asian rodent reservoirs, following climate swings in Central Asia with a lag of about 15 years (plus or minus one). They found no climate signal supporting long-lived wildlife reservoirs inside Europe. It is an influential result, but it is one statistical study of an incomplete archive, and the reservoir question is still argued.
Tamara Ben-Ari and colleagues (PLoS Pathogens, 2011, doi:10.1371/journal.ppat.1002160) caution that plague's response to climate depends on scale and is not linear: what helps fleas in one setting can hurt them in another, and very hot, dry conditions suppress them. How plague moved between people in historic Europe is also debated. Katharine Dean and colleagues (PNAS, 2018, doi:10.1073/pnas.1715640115) argued that human fleas and body lice may explain the fast-moving epidemics of preindustrial Europe better than rats. Others disagree.
Past the rodents, there is a broader claim that cold spells cut harvests, harvest failure brought hunger and war, and hungry, moving populations were more exposed to disease. David Zhang and colleagues (PNAS, 2007, doi:10.1073/pnas.0703073104) found that kind of chain in records from 1500 to 1800. Historians still argue about how far it applies to any one epidemic.
Climate matters for plague. It works through the animals that carry it, and the signal is regional and messy. None of these papers uses solar activity as its driver. They use temperature and rainfall.
5. Following the chain from Sun to plague
So here is the full chain people are reaching for, link by link:
- Quiet Sun to less sunlight. True but small. IPCC AR6 Working Group I (Chapter 2) puts the rise in solar output since the Maunder Minimum at 0.7 to 2.7 watts per square metre, an effective forcing of only about 0.09 to 0.35.
- Less sunlight to the Little Ice Age. Weak and contested (section 2).
- Cooling to failed harvests and social stress. Documented in places, contested as a rule (Zhang 2007).
- Climate to rodent and flea plague. Strong in Central Asia, suggestive for Europe (section 4).
- Quiet Sun directly to plague. I found no peer-reviewed study that shows it.
One deep-time case deserves an honest mention. Ulf Büntgen and colleagues (Nature Geoscience, 2016, doi:10.1038/ngeo2652) described a Late Antique Little Ice Age from 536 to about 660. It was set off by large volcanic eruptions in 536, 540 and 547 and "probably sustained by ocean and sea-ice feedbacks as well as a solar minimum." The authors suggest the cold may have been one factor in the setting of the Justinianic plague. That is the closest the literature comes to putting a solar minimum in the same frame as a plague, and even there the eruptions lead and the Sun is a supporting player.
6. The "mini ice age" scare
Every few years a headline says a new Maunder Minimum is about to cancel global warming. Most trace back to work by Valentina Zharkova and colleagues.
In 2015 in Scientific Reports (doi:10.1038/srep15689), Zharkova's group used a two-dynamo model of the Sun's magnetic field to predict much weaker activity in solar cycles 26 and 27, roughly the 2030s to the 2050s. A 2019 paper by the same group in the same journal (doi:10.1038/s41598-019-45584-3) linked solar activity to the Sun's motion around the solar system's centre of mass. It was retracted on March 4, 2020 (notice doi:10.1038/s41598-020-61020-3). The retraction notice says the paper rested on an incorrect assumption about how the Earth-Sun distance changes with that motion. One co-author agreed with the retraction. Three did not.
Usoskin's 2017 review calls long-range predictions like the 2015 one "speculative" and says no current method can reliably forecast solar activity more than about one cycle ahead. His summary: "a grand minimum should appear sooner or later, but presently we are hardly able to predict its occurrence."
Even if one does arrive, it would barely dent warming.
- NASA (February 13, 2020, "There Is No Impending 'Mini Ice Age'"): a new grand minimum would reduce solar forcing by about 0.1 watts per square metre, about the same as three years of current carbon dioxide growth. Warming from greenhouse gases is about six times larger than the possible cooling from a century-long grand minimum.
- Georg Feulner and Stefan Rahmstorf (Geophysical Research Letters, 2010, doi:10.1029/2010GL042710): a new Maunder-like minimum would offset no more than 0.3 °C of warming by 2100.
- Gerald Meehl and colleagues (Geophysical Research Letters, 2013, doi:10.1002/grl.50361): a 0.25 percent drop in solar output would slow warming by up to several tenths of a degree, not stop it.
- Sarah Ineson and colleagues (Nature Communications, 2015, doi:10.1038/ncomms8535) modelled about 0.12 to 0.13 °C of global cooling over 2050 to 2099, about a two-year delay in warming, with larger regional effects in winter.
- NOAA Climate.gov (reviewed by solar physicist Judith Lean, 2025): greenhouse warming "will overpower even a very strong Grand Solar Minimum." The Sun contributed 0.01 °C or less of warming over the industrial era.
- IPCC AR6 Working Group I: human-caused warming from 1850 to 1900 through 2010 to 2019 was about 1.07 °C (likely range 0.8 to 1.3), while natural drivers, the Sun and volcanoes, contributed somewhere between minus 0.1 and plus 0.1 °C. AR6 puts human forcing in 2019 at 2.72 watts per square metre. AR6 does not separately assess a future grand minimum.
A grand minimum is possible but nobody can currently predict one. If it comes, the best estimates of its effect cluster around 0.1 to 0.3 °C of cooling, set against human-caused warming of 1.37 °C (range 1.1 to 1.7) above the 1850 to 1900 average in 2025, according to the Indicators of Global Climate Change 2025 update (Forster et al., Earth System Science Data, 2026, doi:10.5194/essd-18-3889-2026), and more on the way. Claims that one is imminent and will bring an ice age are not supported. The headline paper behind the strongest version was retracted.
7. Where the Sun actually is now
On NOAA Space Weather Prediction Center's own sunspot count, Solar Cycle 25 peaked at a smoothed 153.6 in October 2024. That is above the 2019 NOAA/NASA prediction panel's call for a peak of 115 in July 2025, and above Cycle 24's peak of 124.9 on the same count. The last smoothed value is 96.1, for March 2026. The September 2026 monthly value is 68.7, and the average for January to September 2026 is about 90. SWPC treats its latest six months as preliminary. Its prediction has the yearly mean falling to about 76 in 2027, 46 in 2028, 25 in 2029 and 12 in 2030, heading for the next minimum around the end of the decade.
The Sun is past its peak and winding down, as it does every cycle. Cycle 25 came in stronger than forecast, not weaker. The quiet years ahead are the normal low point of an 11-year cycle. Telling that apart from a grand minimum takes decades of data.
8. Plague today
Plague has not gone away. It lives in natural foci, places where the bacterium circulates in wild rodents and their fleas, on every inhabited continent except Oceania, according to WHO's fact sheet. Most human cases now come from the Democratic Republic of the Congo and Madagascar, where the season runs roughly September to April. Peru reports cases regularly (WHO, WER 91(8)), and foci persist in the western United States and across Central Asia, China and Mongolia.
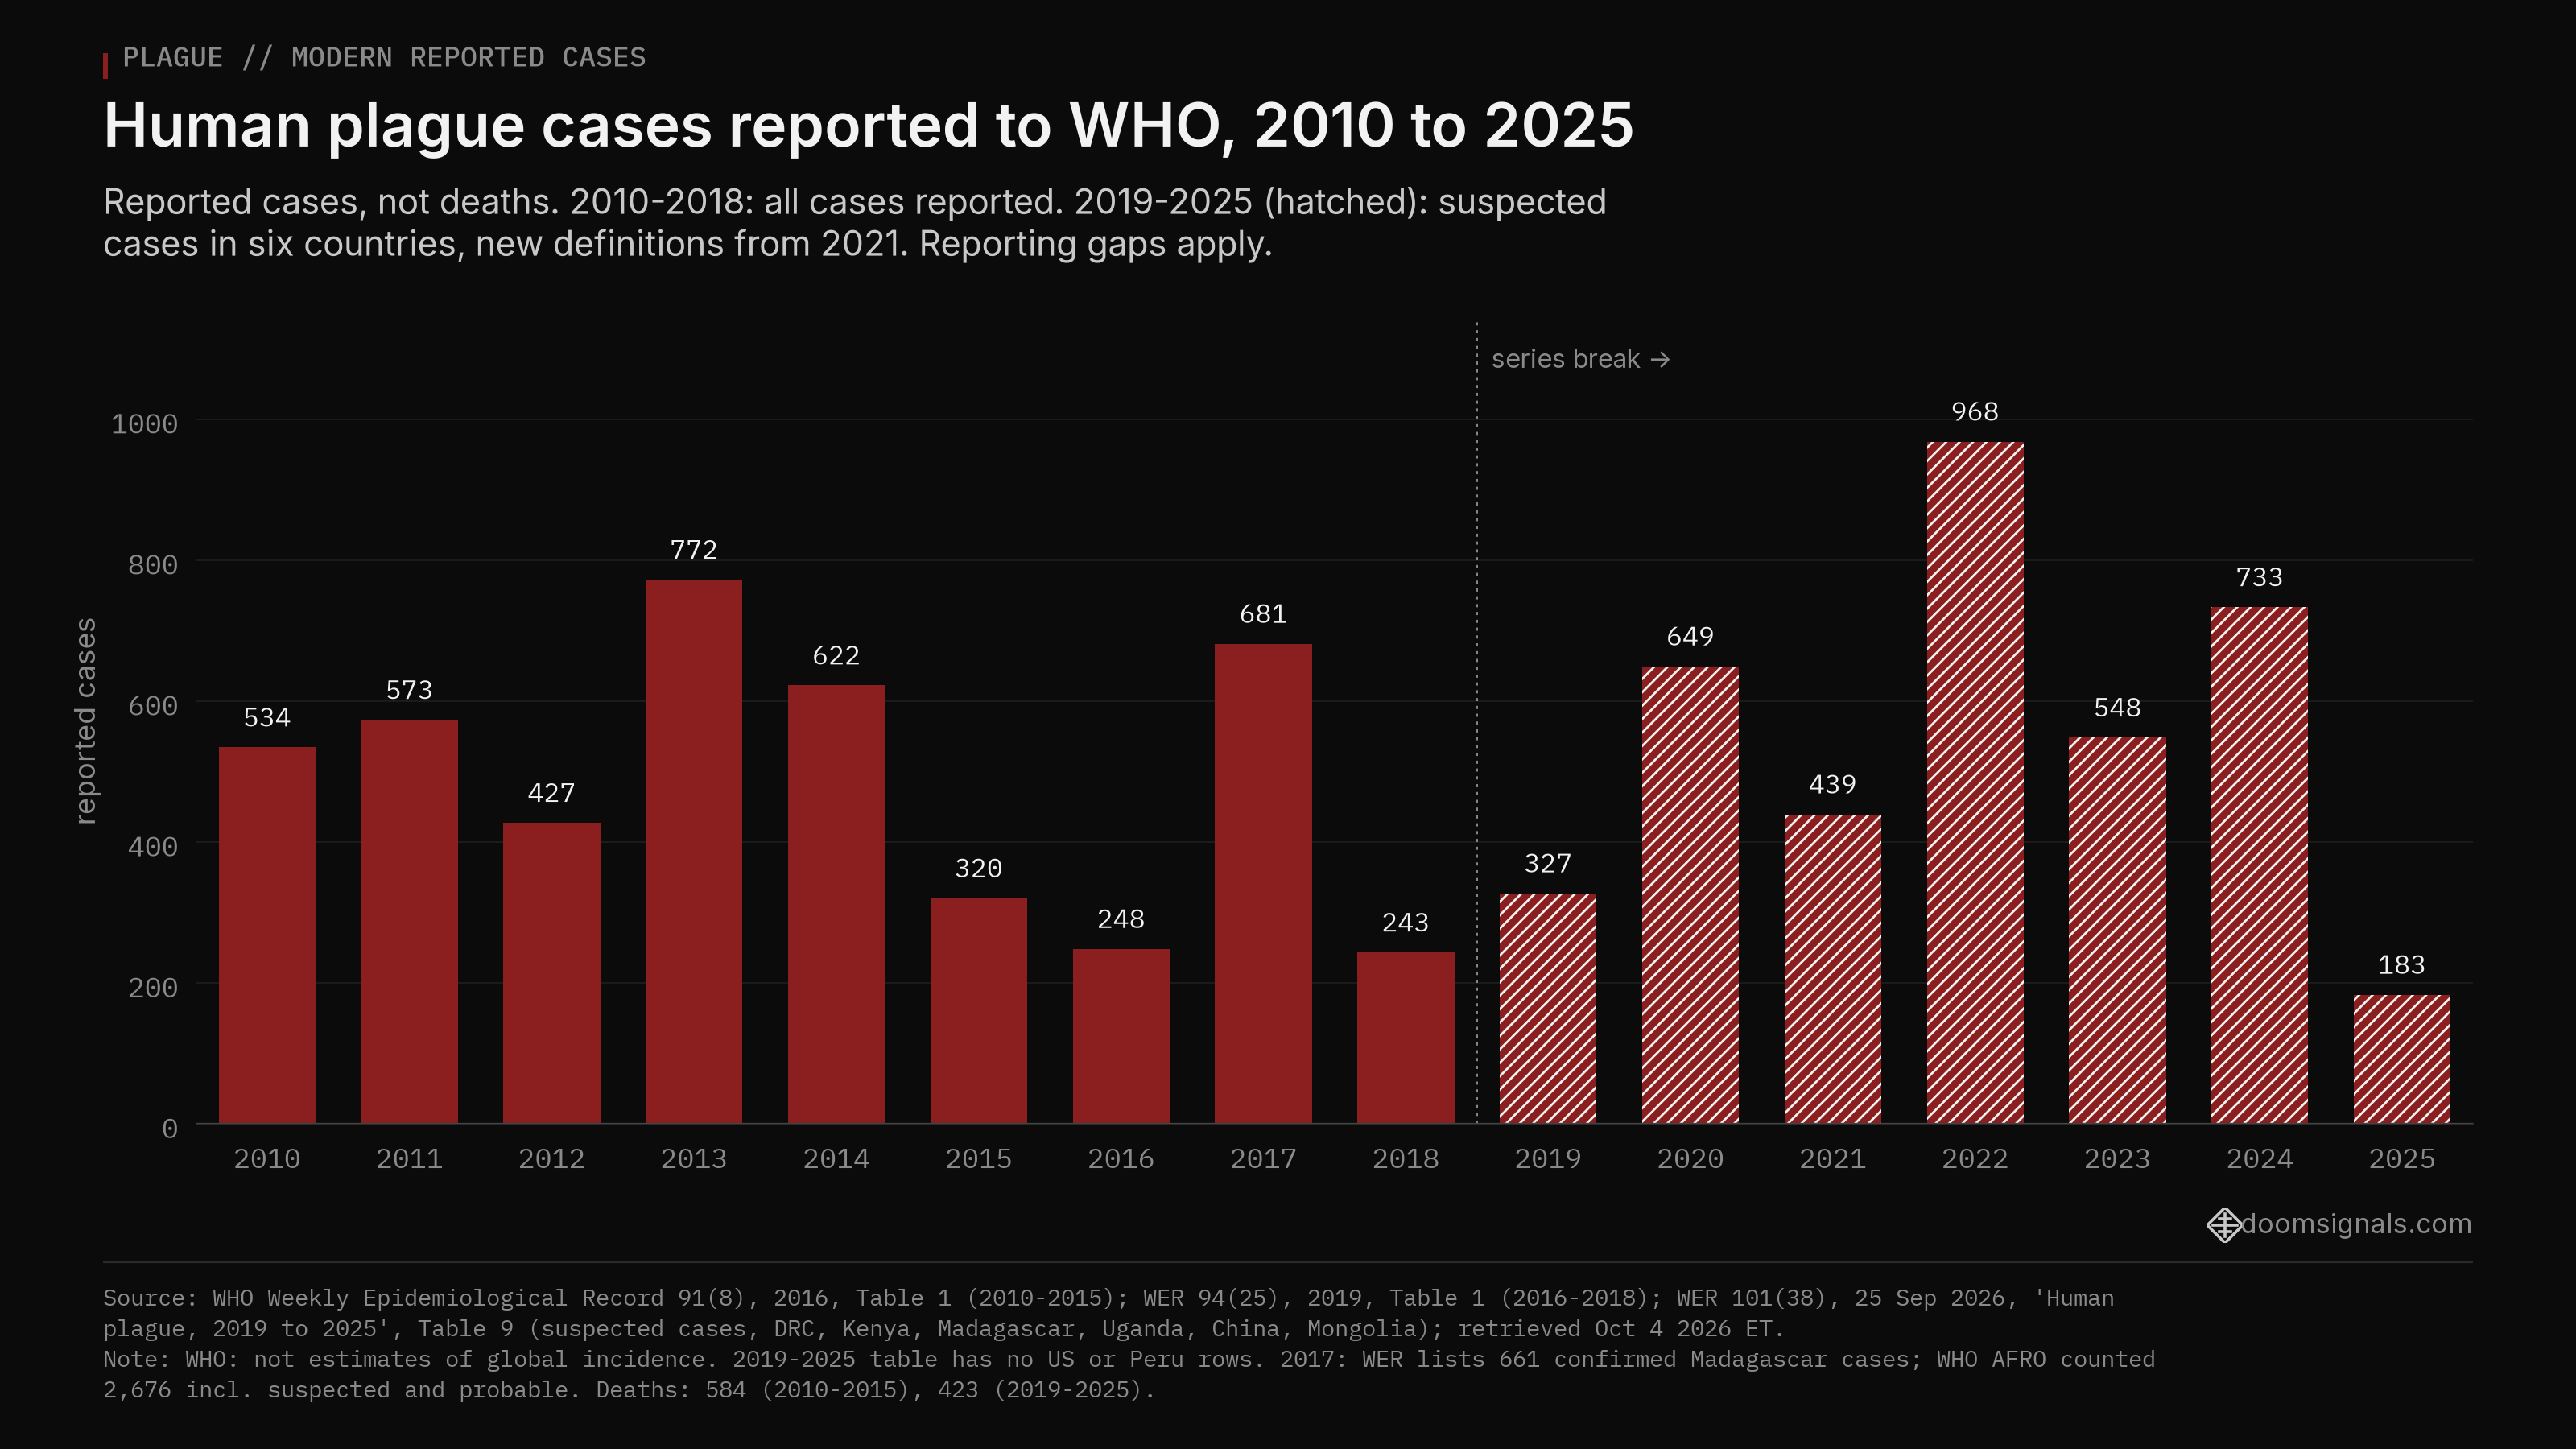
WHO's Weekly Epidemiological Record counted 3,248 cases and 584 deaths worldwide from 2010 to 2015 (WER 91(8), 2016). The yearly totals in WER issues ranged from 248 to 772 cases between 2010 and 2018. Madagascar's 2017 urban outbreak reached 2,676 cases and 238 deaths in WHO's African Region tally, which included suspected and probable cases. The WER table lists 661 confirmed cases for Madagascar that year.
The newest WHO review, published September 25, 2026 (WER 101(38), "Human plague, 2019 to 2025"), counts 3,847 suspected cases, 2,646 confirmed cases and 423 deaths over those seven years, for a case fatality ratio of 11 percent. Six countries reported confirmed cases: the DRC, Madagascar, Kenya, Uganda, China and Mongolia. Kenya's were its first confirmed cases, in 2021. WHO revised its case definitions in 2021 and says these numbers are not estimates of global incidence. The chart marks the break in the series for that reason. That table has no rows for the United States or Peru. The US Centers for Disease Control and Prevention says the US averages about seven human cases a year (range 0 to 17), mostly in northern New Mexico, northern Arizona and southern Colorado.
In Russia, WER 91(8) records a 2014 case in a marmot hunter in the Altai Republic, the first in that region since 1961. Our Irkutsk note cites Rospotrebnadzor's Altai office for Russia's most recent case, a 10-year-old boy who survived, in July 2016. WHO's 2019 table does not list it.
WHO's fact sheet says untreated bubonic plague kills 30 to 60 percent of patients, and untreated pneumonic and septicaemic plague are always fatal. Untreated pneumonic plague can kill within 18 to 24 hours. Common antibiotics work well if given early. That is why rapid diagnosis matters, and why a lab statement like Rospotrebnadzor's carries so much weight.
Today's plague burden runs to hundreds of cases a year, not millions. It tracks poverty, rodent contact and how fast clinics respond. Cases kept coming through the solar maximum of 2024 and 2025.
9. What the evidence says
Strong
- Grand solar minima happened, and the Maunder Minimum (1645 to 1715) is well documented in the sunspot and isotope records.
- Climate drives plague in its wild reservoirs. Warmer, wetter conditions boost plague in Central Asian gerbils and their fleas (Stenseth 2006, Kausrud 2010).
- A future grand minimum would have a small climate effect, about 0.1 to 0.3 °C, far smaller than greenhouse warming (NASA, NOAA, Feulner and Rahmstorf 2010, Meehl 2013, IPCC AR6).
- Plague persists in natural foci on most continents, and it is treatable with early antibiotics (WHO).
Moderate or suggestive
- Climate swings in Central Asia were followed by plague reintroductions into European ports about 15 years later (Schmid 2015).
- Volcanic cooling after 536, with a solar minimum playing a supporting role, may have been one factor around the Justinianic plague (Büntgen 2016).
Weak or contested
- The Maunder Minimum caused the Little Ice Age. Volcanoes and internal variability explain more of it (Owens 2017, Schurer 2014, Miller 2012, Neukom 2019).
- A general chain from cooling to harvest failure to social crisis (Zhang 2007).
- Rats as the main driver of historic European spread, versus human fleas and lice (Dean 2018).
Unsupported
- Solar minima as a direct driver of plague outbreaks. I found no peer-reviewed study that shows it.
Debunked or retracted
- An imminent "mini ice age." The 2019 Zharkova paper was retracted, the 2015 predictions are called speculative, and even a real grand minimum would not stop warming.
What I'm watching
Irkutsk is the reminder. One unexplained death at a plague lab moved faster online than the lab results, and the useful update came from the agency that ran the tests. The Sun got pulled into the same panic, and the long records don't support that either.
So when plague shows up in the news, I watch the reservoirs and the clinics: WHO's tables, Madagascar's season, the DRC, the Altai. When the Sun shows up, I watch SWPC's cycle numbers. And when someone hands me a chain from sunspots to death carts, I check every link. The rodent links hold up. The Sun link doesn't.
Jp
Doom Signals
Sources named on this page, with DOIs inline. Full list with retrieval times: doomsignals.com/sources
Every chart names its data source and retrieval date on the image: NOAA NCEI (Hoyt and Schatten group sunspot numbers), NOAA SWPC, PAGES2k / NOAA NCEI Paleoclimatology, Met Office Hadley Centre / CRU HadCRUT5, Steinhilber et al. 2009, WHO Weekly Epidemiological Record.
Methodology · Sources · Corrections · Will not · doomsignals.com